Picture this: you’re starting the day and your dashboard is already lighting up with campaign alerts. One of your top Meta video ads is showing signs of fatigue. It’s been a reliable driver for weeks, but now performance is sliding. Every extra dollar you put into it brings fewer conversions than before.
If you run e-commerce ads, you’ve probably seen this play out. Audiences cycle through creative fast on Meta, so ad fatigue sets in quickly. But when performance starts to slip, the cause might not be obvious. You’re left juggling multiple data sources and testing new creatives, which makes it harder to stay on top of performance.
To give performance marketers a clearer view of what’s really happening with their ads, we built Explorer.
In this guide, we’ll break down how Explorer helps you make sense of creative performance on Meta Ads. You’ll find out what to expect from the tool and how it can help you get more from your ad spend.
Note: People still often say “Facebook Ads,” but this guide covers the full Meta Ads ecosystem—including Facebook, Instagram, Messenger, WhatsApp, and the Audience Network. To reflect that, we will use “Meta Ads” throughout the article.
Key takeaways
Creative fatigue on Meta drains budget fast and is difficult to detect with standard reporting.
Explorer gives e-commerce marketers clearer visibility into which creatives are driving or wasting spend.
Built-in templates surface top ads, underperformers, and fatigued creatives without manual setup.
Reports can group creatives by media, post IDs, or naming conventions for deeper comparisons.
Insights connect directly to automation, so teams can pause, scale, or adjust ads without switching tools.
Why we built Explorer
It started with a simple but costly problem: creative fatigue. When an ad keeps costing you but delivers fewer clicks and conversions, it quietly drains budget.
In 2023, we ran a survey to understand how marketers deal with creative fatigue. As Nikita Cheryomin, Product Designer at Bïrch, explained, the poll began with a simple question:
“Do you have a problem with finding fatigued creatives? If yes, how do you find them?
The survey showed that there wasn’t a single tool that covered this need, and in the interviews, nobody could name a good solution, either. Yet it’s an important issue, because it’s essentially about budget.”
This shaped the foundation for Explorer. Creatives are the biggest driver of results on Meta Ads, and with targeting and bidding now largely automated, performance depends on knowing which ads to keep running and which to cut. Explorer gives you the visibility to spot fatigue early and make those choices with confidence.
Turn data into better creative decisions
Explorer is designed to make ad creative analysis more practical and actionable for performance teams.
Keep budgets focused on winners: Flag ads that are burning spend without driving sales, so you can pause them before they drag down ROAS.
Comparing creatives side by side: Group ads by media files, post IDs, or naming conventions to see how different versions perform across audiences or formats.
Detect downtrends or fatigue early: Spot downtrends with charts and filters that reveal when a creative starts slipping, giving you time to refresh it.
Save time with built-in templates: Use prebuilt templates to get an instant view of your top ads, underperformers, or fatigued creatives.
Turning insights into action: Create rules directly from a report. If you find a fatigued ad or a strong performer, you can adjust spend or pause it right away.
Tailor reporting with custom metrics and integrations: Use advanced filters, custom KPIs, and integrations to shape reports around exactly what you need to measure.
How marketing teams use Explorer
Here’s how marketers can use Explorer to spot fatigue, find winners, and act on insights in a single report.
Spot your best-performing creatives
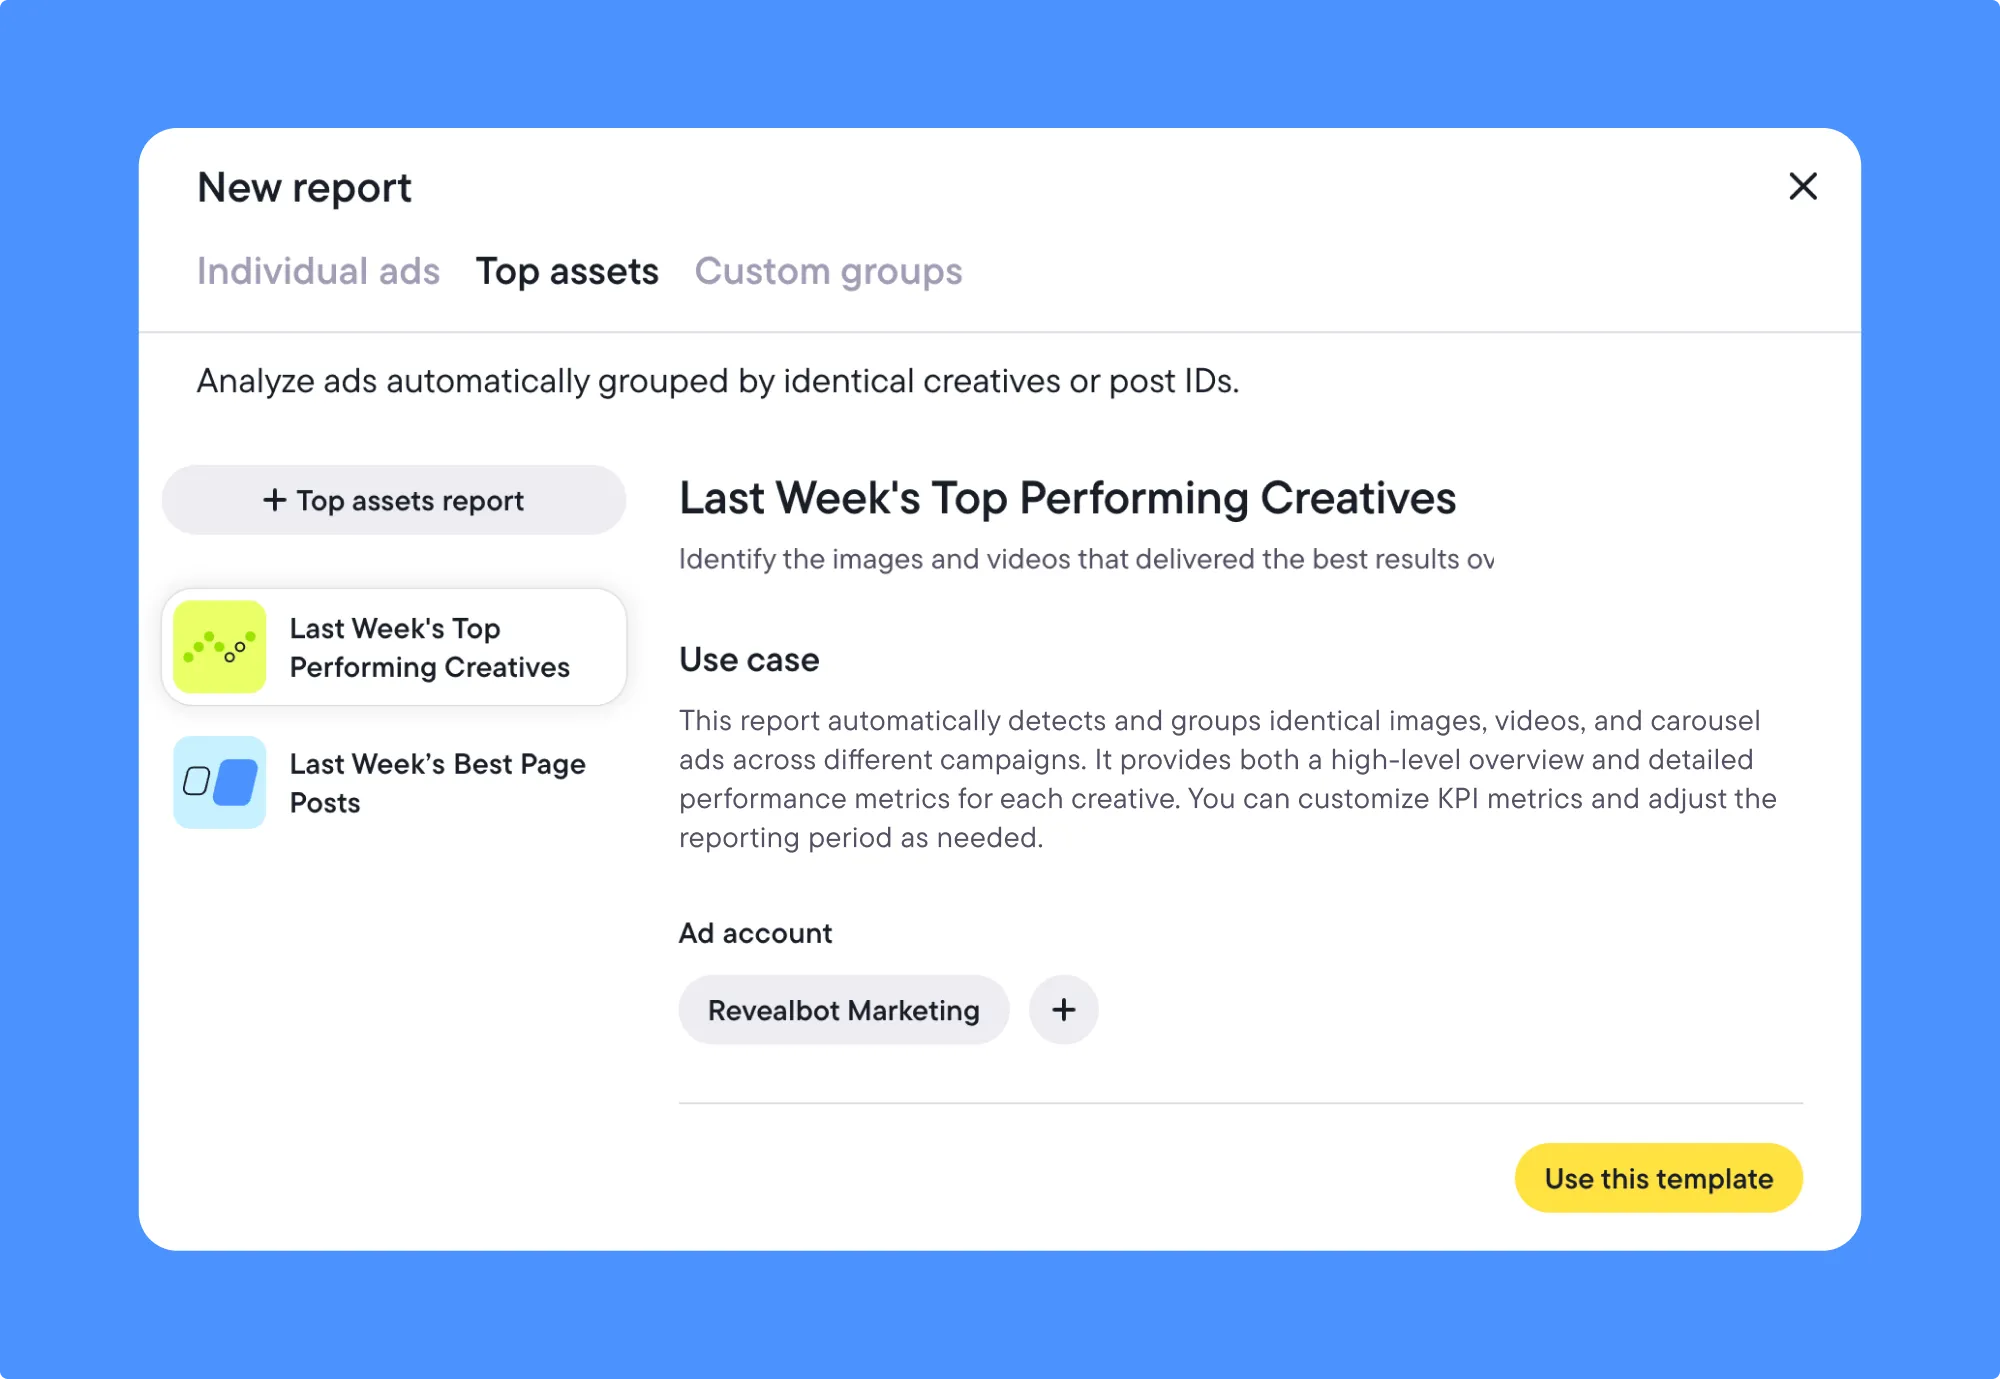
Use the template Last Week’s Top Performing Creatives in the Top assets report. Ads are automatically grouped by identical images, videos, or carousels, and the strongest performers from the past seven days rise to the top. Scale what’s working and set the pace for your next round of testing.
Find fatigued ads before results drop
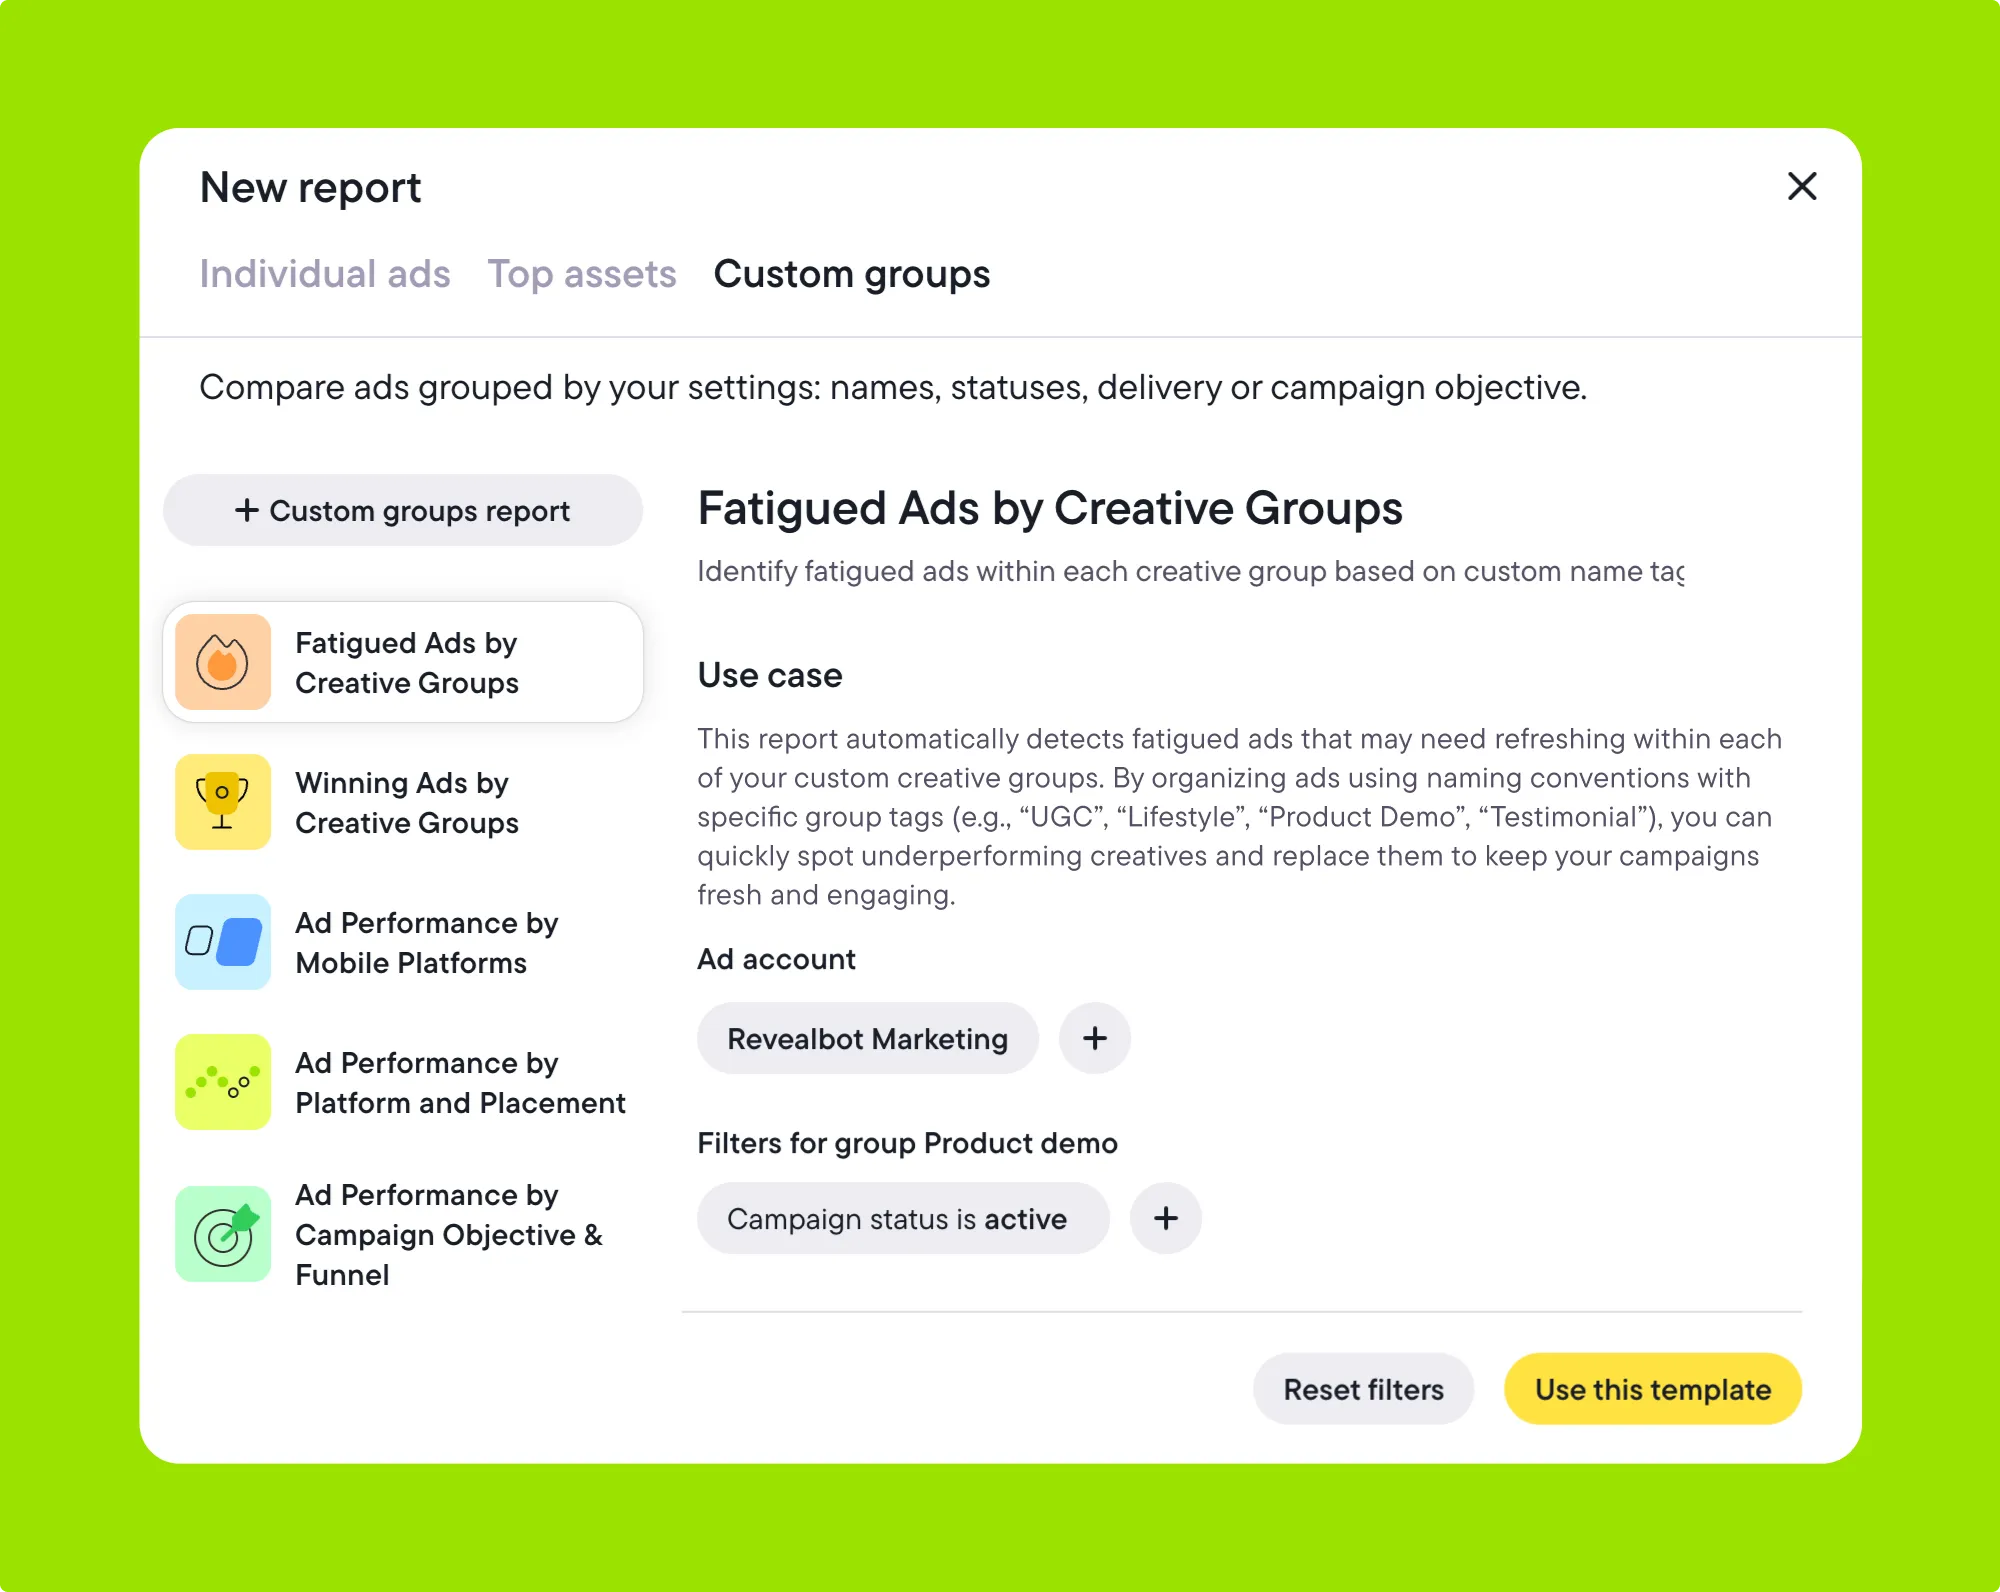
Switch to Fatigued Ads by Creative Groups in Custom groups. Ads are organized by the naming tags you’ve set, like UGC, lifestyle, or product demo. Retire the underperformers early and keep campaigns running efficiently.
Catch downtrending ads early
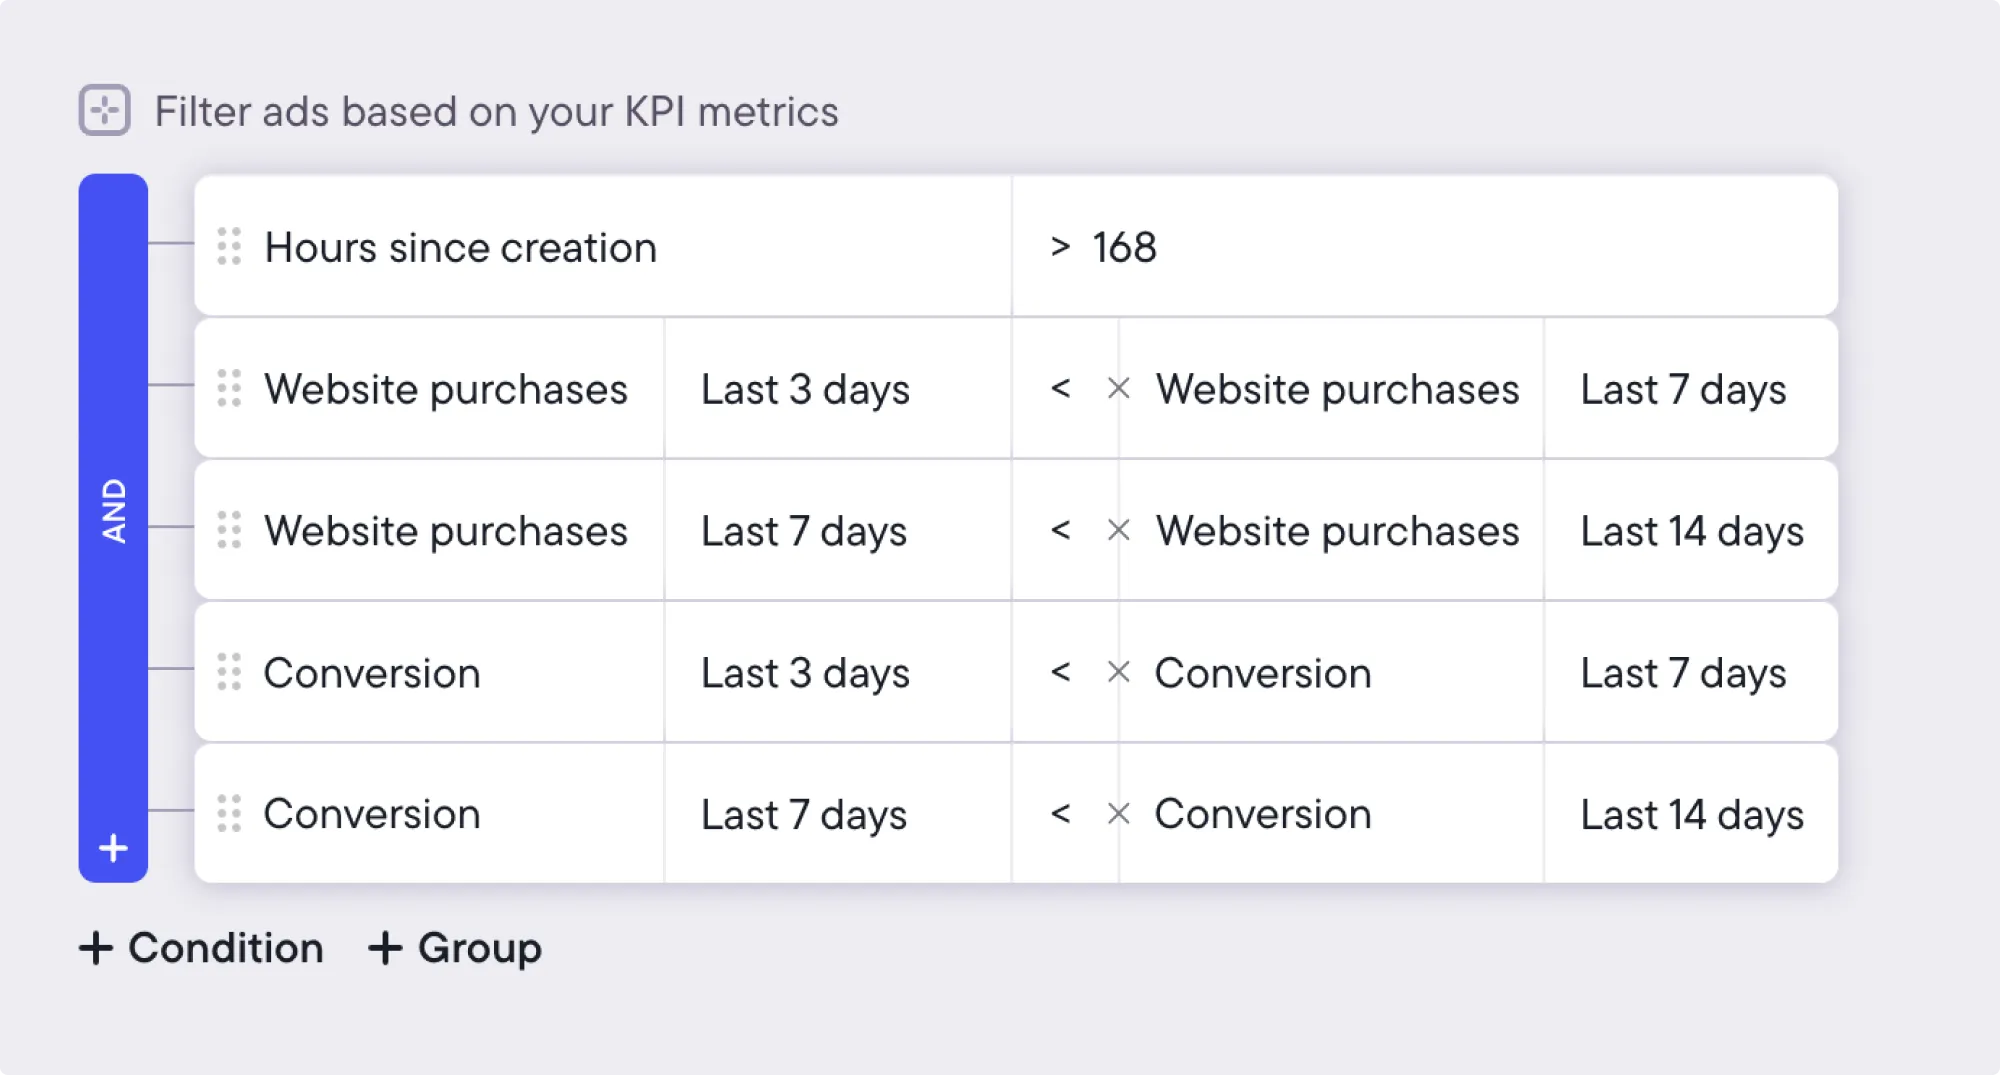
Open the Downtrend report to see ads with slipping results from the past 14 days. It highlights creatives with falling purchase volume and conversion rates, even if they’re still spending. Use this as an early signal to refresh before performance slips further.
Automate next steps directly from insights
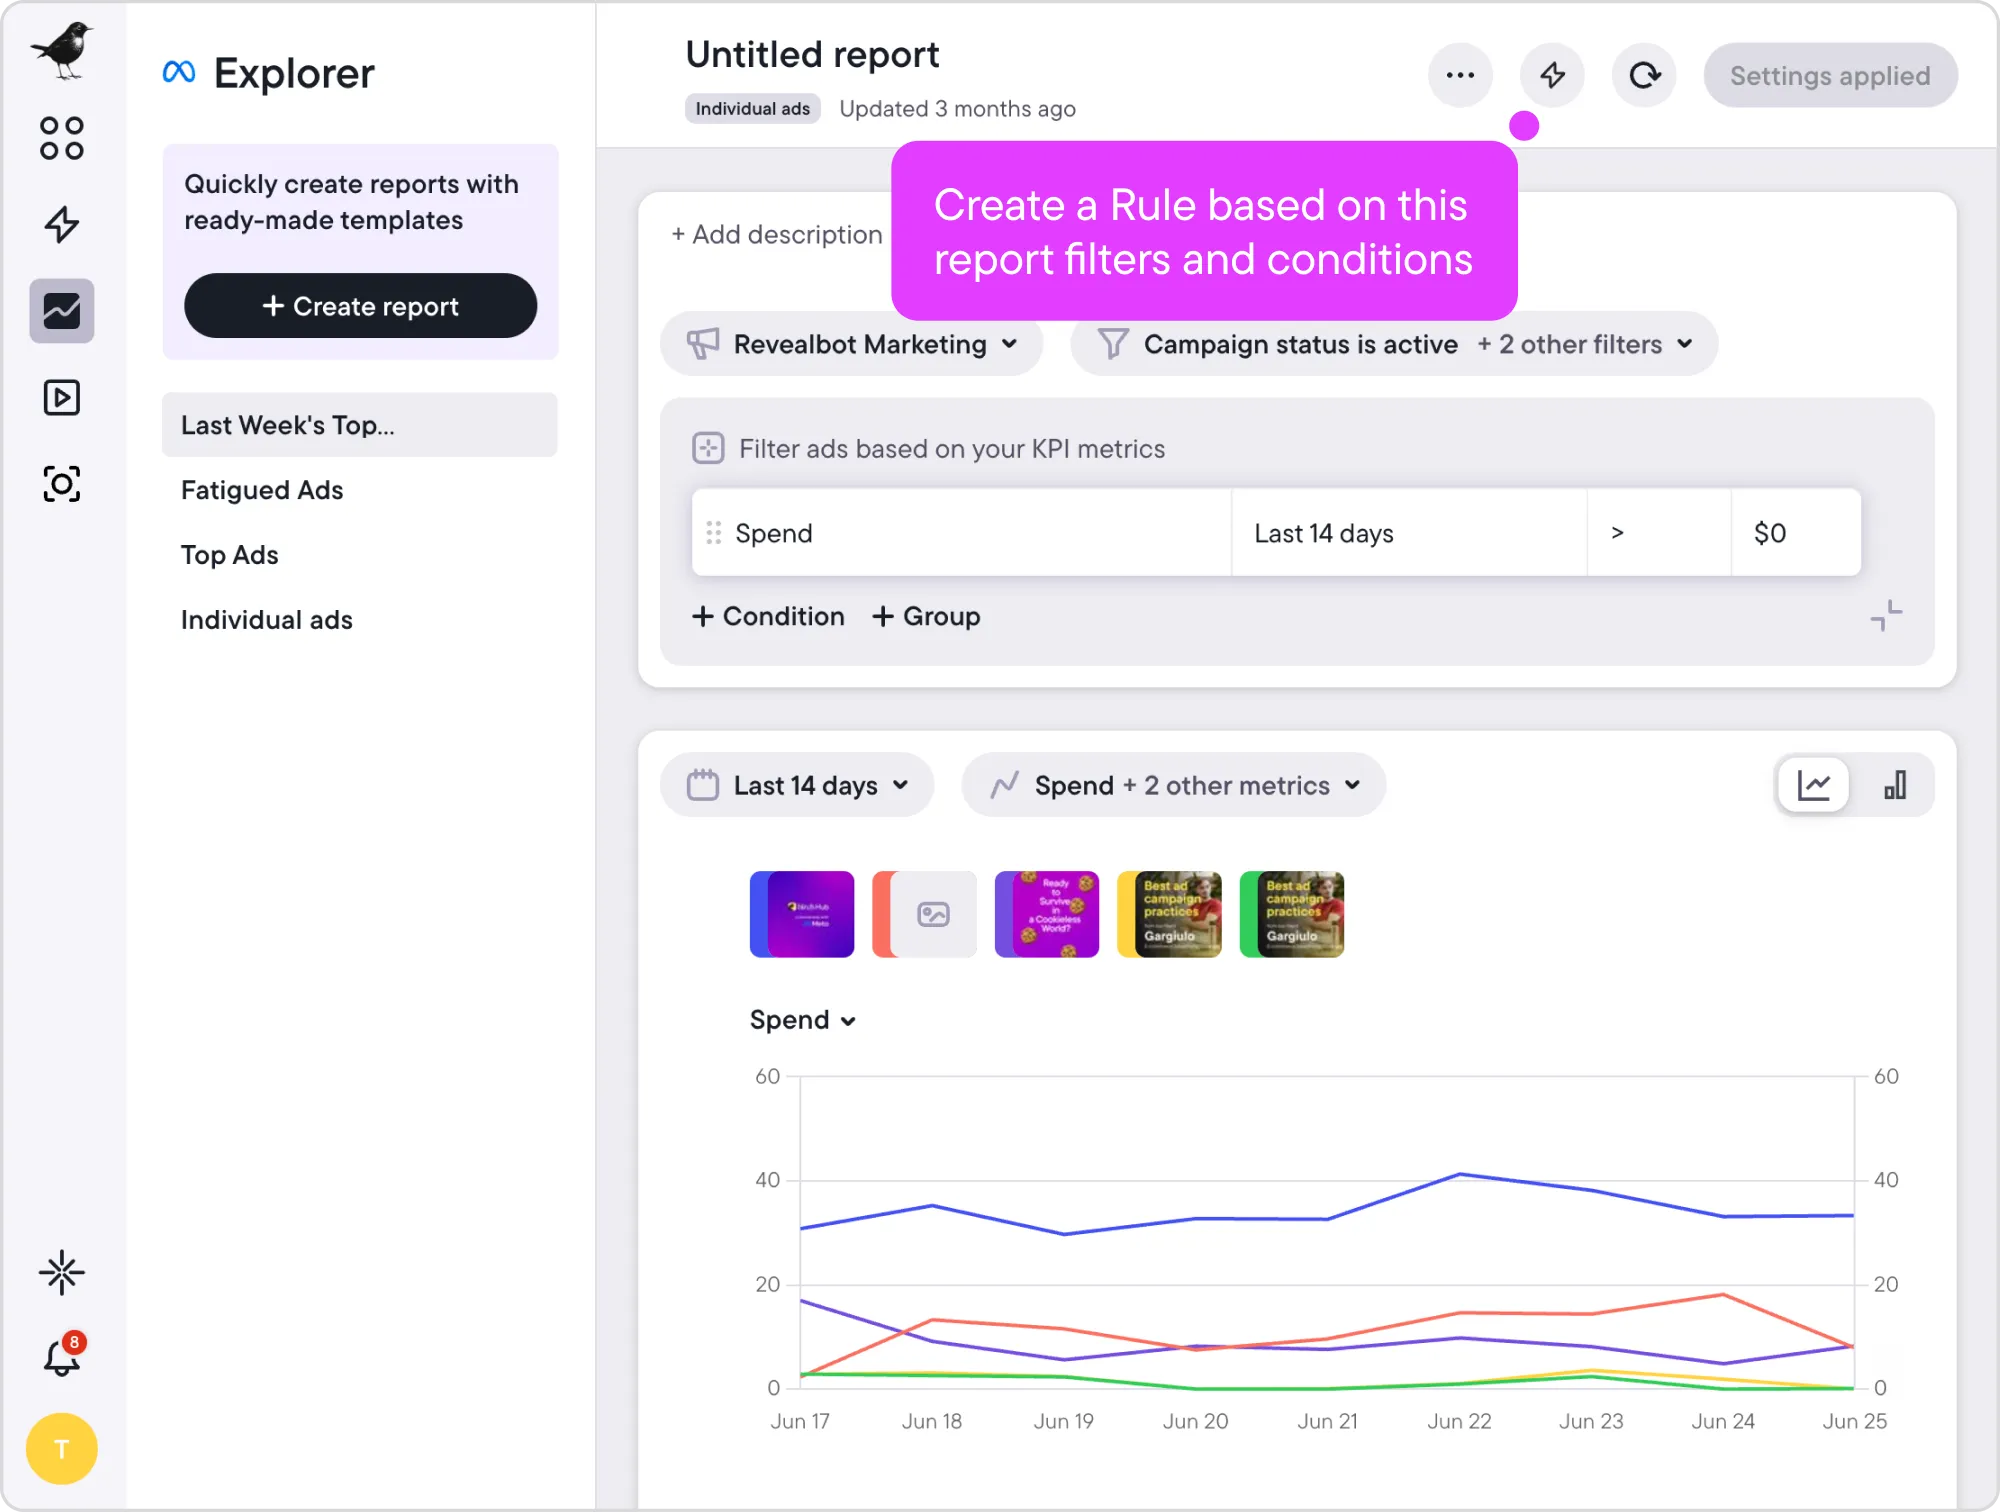
From any Individual ads report, click the lightning icon to turn your filters into a new rule. The account, conditions, and metrics you’ve set carry over automatically, so you don’t have to rebuild them. Preview the matching ads, make adjustments if needed, and set the rule to live to act on your findings right away.
Explorer vs. other creative analytics tools
Platforms like Madgicx and AdEspresso position themselves as some of the best tools for creative performance insights—but most stop at surface-level reporting. They let you track results on a single metric, without the flexibility to analyze performance in different ways.
That makes it harder to spot the real signs of fatigue, since ad performance rarely drops in just one place. A click-through rate might still look fine, even though conversions are already sliding.
Explorer was built differently. Instead of limiting analysis to one metric, it lets you combine multiple metrics and apply Conditions to filter performance in a way that reflects your actual goals.
As Nikita explained: “The most powerful [Explorer] feature—one that competitors definitely don’t have—is Conditions. Our metric filters are, I think, the most powerful on the market. Plus, you can use custom metrics and connect integrations. If you adopt it, you can find just about any information you want.”
Why Explorer stands out
Explorer solves problems that other ad reporting tools overlook.
Conditions-based filtering: Instead of checking one metric at a time, you can layer conditions together. For example, flag ads with high spend but falling CTR, or find creatives that hit your CPA and ROAS goals at the same time.
Custom metrics and integrations: Bring in the KPIs that matter most to your business, not just the defaults from Meta. Whether it’s margin-based ROAS or data pulled from another platform, reports reflect your actual goals.
Flexible grouping: Analyze ads by identical media, post IDs, or naming conventions. This makes it easier to compare variations, run A/B tests, or see how a creative performs across different audiences.
With Explorer, you can move from reporting to action in the same workflow. Launch an ad, review performance, and apply rules without switching tools. And once those rules are running, Bïrch AI analyses your full rule setup and ad account data to surface the contradictions, the blind spots, and the setups worth doubling down on.
Stop guessing and start exploring trends and fatigue insights in a single view.
Ready to use Explorer in your workflow?
When an ad’s performance starts slipping, every hour of wasted spend cuts into margin and gives ground to competitors. Most tools only show you the problem when the damage is already done.
Explorer is built for that moment. It shows you when performance turns, helps you see which creative still pulls weight, and lets you act on the insight immediately. That speed is the difference between protecting ROAS and wasting budget.
Bïrch brings creation, analytics, and automation into a single platform. You don’t have to stitch together different tools to act on what you learn. Everything happens in one place, which means less overhead, clearer reporting, and more time to focus on the work that drives growth.
Explore Bïrch with a 14-day free trial
FAQs
How can I detect ad fatigue?
Watch for rising spend with falling results. A clear sign of fatigue is when conversions or CTR decline while an ad keeps spending. Tools like Explorer flag these trends early so you can retire or refresh creatives before they drain budget.
What’s the best way to analyze Facebook creative performance?
Group ads by creative asset—media files, post IDs, or naming conventions—to see how different versions perform side by side. This makes it easier to compare variations, spot winners, and identify what’s slipping.
How can I optimize e-commerce ad spend?
Focus spend on creatives that keep delivering conversions and cut those showing fatigue. Use reports and automation together so you can act on insights immediately, protecting ROAS and getting the most from your budget.
What happened to Revealbot?
Revealbot has a new look and a new name—we’re now Bïrch! The change highlights our focus on bringing together the best of automation and creative teamwork.
Picture this: you’re starting the day and your dashboard is already lighting up with campaign alerts. One of your top Meta video ads is showing signs of fatigue. It’s been a reliable driver for weeks, but now performance is sliding. Every extra dollar you put into it brings fewer conversions than before.
If you run e-commerce ads, you’ve probably seen this play out. Audiences cycle through creative fast on Meta, so ad fatigue sets in quickly. But when performance starts to slip, the cause might not be obvious. You’re left juggling multiple data sources and testing new creatives, which makes it harder to stay on top of performance.
To give performance marketers a clearer view of what’s really happening with their ads, we built Explorer.
In this guide, we’ll break down how Explorer helps you make sense of creative performance on Meta Ads. You’ll find out what to expect from the tool and how it can help you get more from your ad spend.
Note: People still often say “Facebook Ads,” but this guide covers the full Meta Ads ecosystem—including Facebook, Instagram, Messenger, WhatsApp, and the Audience Network. To reflect that, we will use “Meta Ads” throughout the article.
Key takeaways
Creative fatigue on Meta drains budget fast and is difficult to detect with standard reporting.
Explorer gives e-commerce marketers clearer visibility into which creatives are driving or wasting spend.
Built-in templates surface top ads, underperformers, and fatigued creatives without manual setup.
Reports can group creatives by media, post IDs, or naming conventions for deeper comparisons.
Insights connect directly to automation, so teams can pause, scale, or adjust ads without switching tools.
Why we built Explorer
It started with a simple but costly problem: creative fatigue. When an ad keeps costing you but delivers fewer clicks and conversions, it quietly drains budget.
In 2023, we ran a survey to understand how marketers deal with creative fatigue. As Nikita Cheryomin, Product Designer at Bïrch, explained, the poll began with a simple question:
“Do you have a problem with finding fatigued creatives? If yes, how do you find them?
The survey showed that there wasn’t a single tool that covered this need, and in the interviews, nobody could name a good solution, either. Yet it’s an important issue, because it’s essentially about budget.”
This shaped the foundation for Explorer. Creatives are the biggest driver of results on Meta Ads, and with targeting and bidding now largely automated, performance depends on knowing which ads to keep running and which to cut. Explorer gives you the visibility to spot fatigue early and make those choices with confidence.
Turn data into better creative decisions
Explorer is designed to make ad creative analysis more practical and actionable for performance teams.
Keep budgets focused on winners: Flag ads that are burning spend without driving sales, so you can pause them before they drag down ROAS.
Comparing creatives side by side: Group ads by media files, post IDs, or naming conventions to see how different versions perform across audiences or formats.
Detect downtrends or fatigue early: Spot downtrends with charts and filters that reveal when a creative starts slipping, giving you time to refresh it.
Save time with built-in templates: Use prebuilt templates to get an instant view of your top ads, underperformers, or fatigued creatives.
Turning insights into action: Create rules directly from a report. If you find a fatigued ad or a strong performer, you can adjust spend or pause it right away.
Tailor reporting with custom metrics and integrations: Use advanced filters, custom KPIs, and integrations to shape reports around exactly what you need to measure.
How marketing teams use Explorer
Here’s how marketers can use Explorer to spot fatigue, find winners, and act on insights in a single report.
Spot your best-performing creatives
Use the template Last Week’s Top Performing Creatives in the Top assets report. Ads are automatically grouped by identical images, videos, or carousels, and the strongest performers from the past seven days rise to the top. Scale what’s working and set the pace for your next round of testing.
Find fatigued ads before results drop
Switch to Fatigued Ads by Creative Groups in Custom groups. Ads are organized by the naming tags you’ve set, like UGC, lifestyle, or product demo. Retire the underperformers early and keep campaigns running efficiently.
Catch downtrending ads early
Open the Downtrend report to see ads with slipping results from the past 14 days. It highlights creatives with falling purchase volume and conversion rates, even if they’re still spending. Use this as an early signal to refresh before performance slips further.
Automate next steps directly from insights
From any Individual ads report, click the lightning icon to turn your filters into a new rule. The account, conditions, and metrics you’ve set carry over automatically, so you don’t have to rebuild them. Preview the matching ads, make adjustments if needed, and set the rule to live to act on your findings right away.
Explorer vs. other creative analytics tools
Platforms like Madgicx and AdEspresso position themselves as some of the best tools for creative performance insights—but most stop at surface-level reporting. They let you track results on a single metric, without the flexibility to analyze performance in different ways.
That makes it harder to spot the real signs of fatigue, since ad performance rarely drops in just one place. A click-through rate might still look fine, even though conversions are already sliding.
Explorer was built differently. Instead of limiting analysis to one metric, it lets you combine multiple metrics and apply Conditions to filter performance in a way that reflects your actual goals.
As Nikita explained: “The most powerful [Explorer] feature—one that competitors definitely don’t have—is Conditions. Our metric filters are, I think, the most powerful on the market. Plus, you can use custom metrics and connect integrations. If you adopt it, you can find just about any information you want.”
Why Explorer stands out
Explorer solves problems that other ad reporting tools overlook.
Conditions-based filtering: Instead of checking one metric at a time, you can layer conditions together. For example, flag ads with high spend but falling CTR, or find creatives that hit your CPA and ROAS goals at the same time.
Custom metrics and integrations: Bring in the KPIs that matter most to your business, not just the defaults from Meta. Whether it’s margin-based ROAS or data pulled from another platform, reports reflect your actual goals.
Flexible grouping: Analyze ads by identical media, post IDs, or naming conventions. This makes it easier to compare variations, run A/B tests, or see how a creative performs across different audiences.
With Explorer, you can move from reporting to action in the same workflow. Launch an ad, review performance, and apply rules without switching tools. And once those rules are running, Bïrch AI analyses your full rule setup and ad account data to surface the contradictions, the blind spots, and the setups worth doubling down on.
Stop guessing and start exploring trends and fatigue insights in a single view.
Ready to use Explorer in your workflow?
When an ad’s performance starts slipping, every hour of wasted spend cuts into margin and gives ground to competitors. Most tools only show you the problem when the damage is already done.
Explorer is built for that moment. It shows you when performance turns, helps you see which creative still pulls weight, and lets you act on the insight immediately. That speed is the difference between protecting ROAS and wasting budget.
Bïrch brings creation, analytics, and automation into a single platform. You don’t have to stitch together different tools to act on what you learn. Everything happens in one place, which means less overhead, clearer reporting, and more time to focus on the work that drives growth.
Explore Bïrch with a 14-day free trial
FAQs
How can I detect ad fatigue?
Watch for rising spend with falling results. A clear sign of fatigue is when conversions or CTR decline while an ad keeps spending. Tools like Explorer flag these trends early so you can retire or refresh creatives before they drain budget.
What’s the best way to analyze Facebook creative performance?
Group ads by creative asset—media files, post IDs, or naming conventions—to see how different versions perform side by side. This makes it easier to compare variations, spot winners, and identify what’s slipping.
How can I optimize e-commerce ad spend?
Focus spend on creatives that keep delivering conversions and cut those showing fatigue. Use reports and automation together so you can act on insights immediately, protecting ROAS and getting the most from your budget.
What happened to Revealbot?
Revealbot has a new look and a new name—we’re now Bïrch! The change highlights our focus on bringing together the best of automation and creative teamwork.
is a writer and SEO strategist focused on marketing, performance, and the digital landscape. She's a contributing writer for Bïrch, with a background in content strategy and client account management.