Facebook ads CTR dropping? Find out which creatives are losing attention with Bïrch Explorer.
If you’re a Meta advertiser, you’ve likely dealt with low CTR at some point. Perhaps you’ve asked yourself, “What’s a good CTR for Facebook ads" anyway.
A good CTR depends on your industry, audience, creative format, and how often your ads have already been shown. There's no single ideal benchmark—context is everything.
What matters more is reading CTR as a creative health signal. A drop usually means ad fatigue, a weak hook, or misaligned messaging, and it shows up before your CPA or ROAS start to slip.
What is a “good” CTR? Context is everything
There’s no one-number-fits-all answer to what a good CTR is, because it varies widely by platform, industry, and creative type. CTRs look different across major social media platforms.
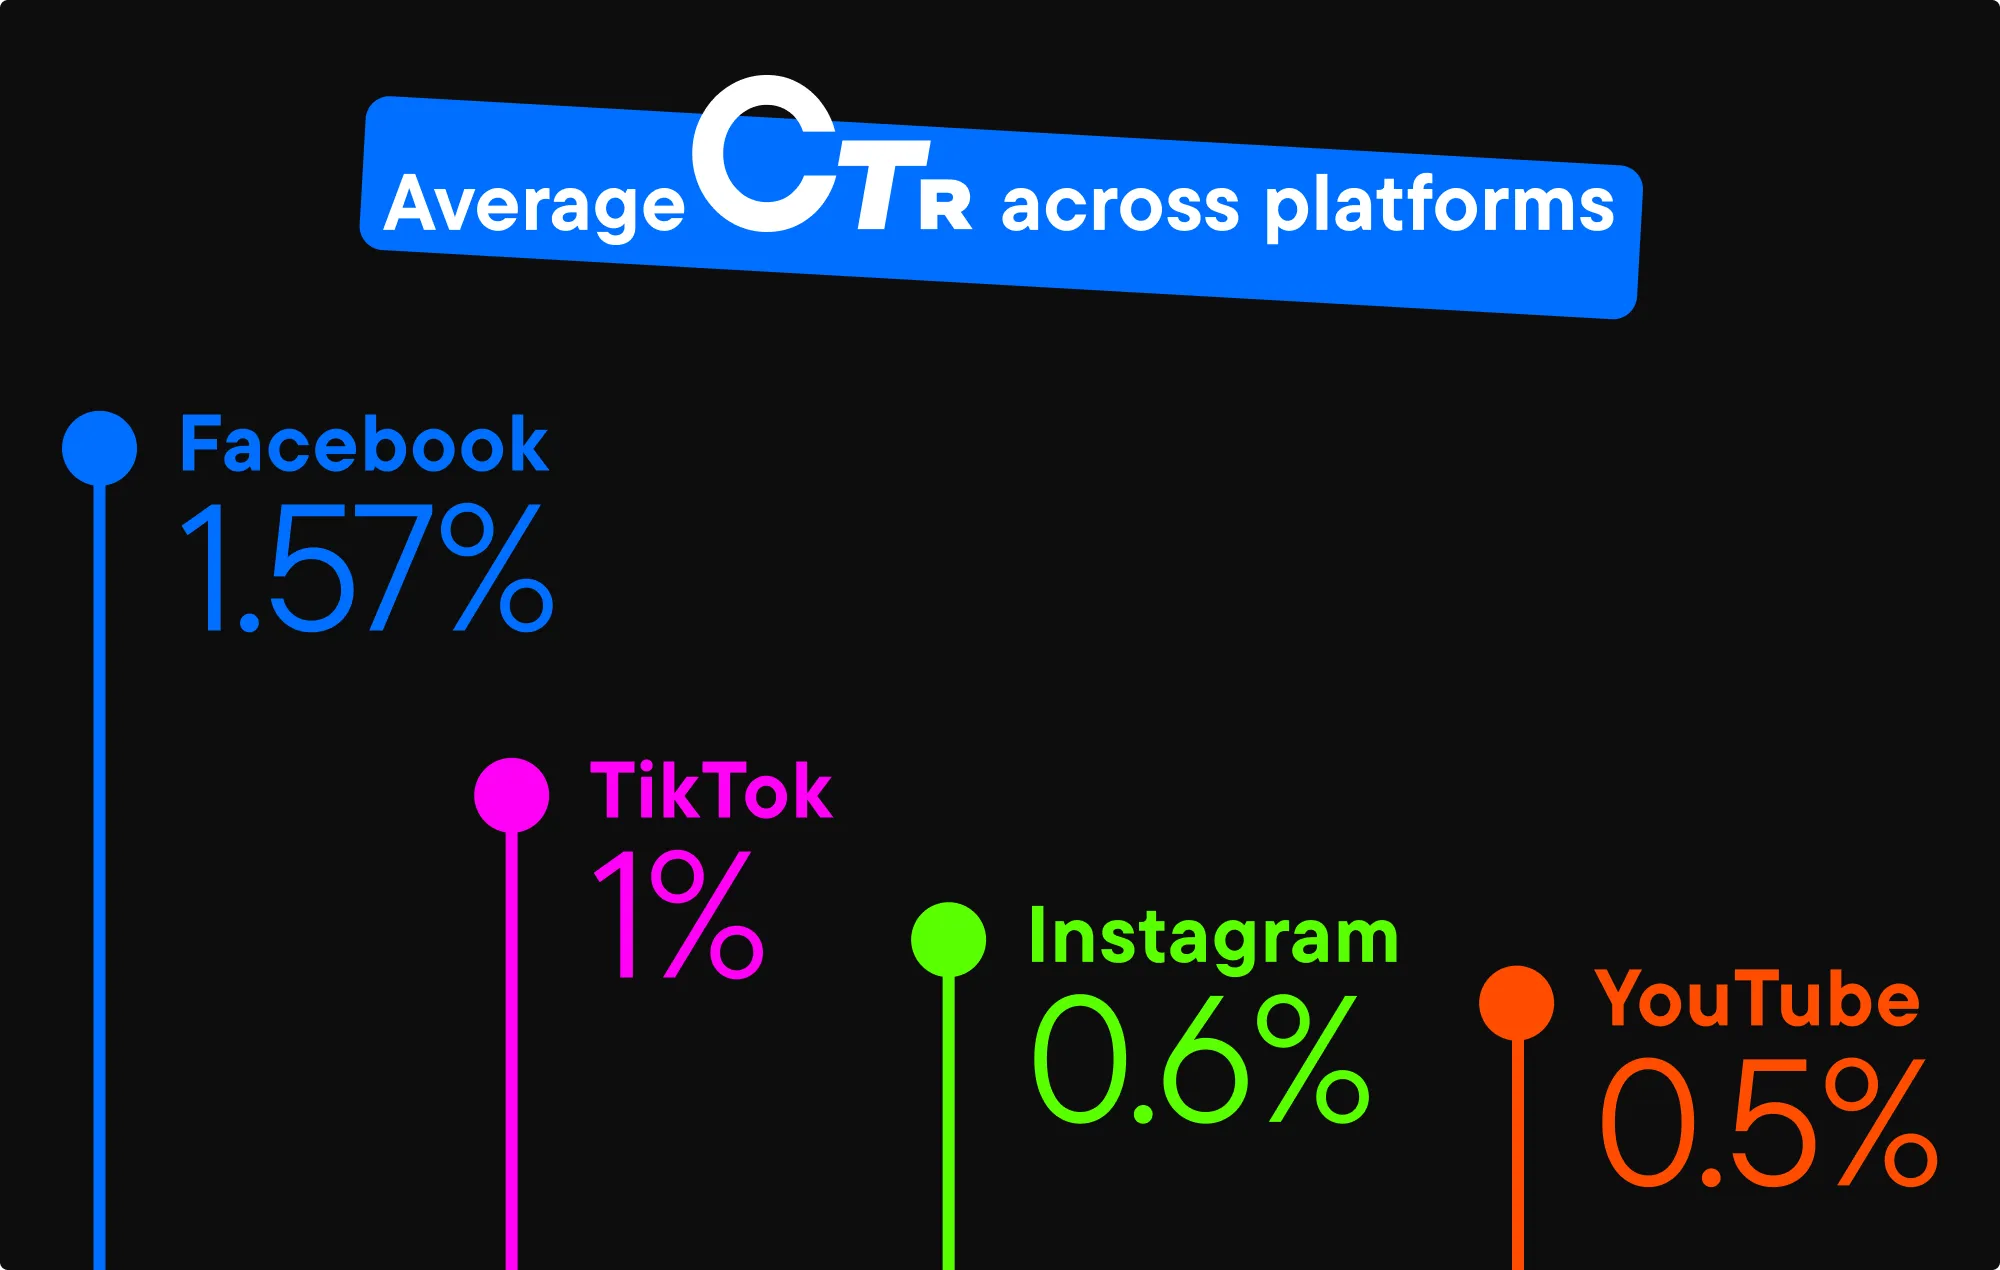
On Facebook (Meta), the average CTR sits around 1.57%, with Feed placements performing best. Facebook users are generally more open to clicking, especially when ads use UGC-style videos.
Instagram, while part of the same ecosystem, tells a slightly different story. CTRs here are usually lower—often around 0.6%, depending on placement. Reels can drive strong reach, but clicks are less consistent unless the creative feels native and fast-paced.
On TikTok, CTR typically sits just under 1%. People are more likely to continue scrolling rather than clicking on an ad.
YouTube generally sees the lowest CTRs, averaging around 0.5–0.6% for skippable video ads.
The following creative formats work best across platforms:
- UGC and creator-led ads consistently outperform polished brand creatives.
- Short-form video drives higher CTR than static formats when it feels native.
- Premium placements (like TikTok TopView or high-attention Feed placements) can deliver outsized results.
On Meta:
- Feed video remains the most reliable placement for CTR.
- Reels can underperform unless the creative feels organic.
- Creator-led Reels can jump well above average.
Industry context makes an even bigger difference. The average click-through rate in Facebook ads for traffic campaigns across all industries is 1.71%.
According to the Facebook advertising benchmarks for 2025, the three top industries with higher CTRs are shopping, collectibles, and gifts (4.13%), travel (2.76%), and sports and recreation (2.60%).
Meanwhile, the industries with the lowest CTRs were automotive-repair, services, and parts (0.80%), physicians and surgeons (0.83%), and finance and insurance (0.98%).
Purchase intent and emotional pull are what drive clicks. Industries like shopping, travel, and recreation are attractive anytime. People don’t need to be actively searching for a problem to feel tempted by a product, trip, or experience.
On the other hand, industries like automotive repair, healthcare, and finance operate very differently. Someone isn’t likely to engage with a car repair ad unless they need to, just as most people won’t click on insurance ads unless they are actively comparing options.
In these cases, high-quality visuals alone won’t significantly impact CTR.
The creative drivers that move CTR
Low CTR, in most cases, comes down to a few creative fundamentals that need a closer look.
Your hook does most of the heavy lifting. Users decide whether to keep watching or scroll past within 1–3 seconds. If nothing captures their attention, they won’t click.
Let’s look at this VSCO Facebook video ad as a reference.
The hook here is bold and instantly informative. The large on-screen text (“4 ways to get the bloom effect”) tells viewers what they will gain in the first second, while still driving curiosity to watch and learn how.

Bright kinetic text, high contrast, and fast pacing mean the message is hard to miss while scrolling.
This kind of hook works especially well for educational and product-led ads. Visual dominance helps stop the scroll and drive clicks.
After the hook, format and patterns are what keep CTR from dropping. Switching between formats—for example, using creator-style videos, raw phone footage, or motion graphics—helps your creatives feel fresh and less like ads.
This is also where messaging and audience come into play. A hook that works perfectly for a cold audience might fall flat with warm users, and vice versa. Cold audiences usually respond better to curiosity, pain points, and problem-aware messaging, while warm audiences are more likely to click when the message is clear and benefit-led.
CTR drops quickly when the message doesn’t match where your audience is in the funnel—even if the creative itself looks strong.
However, not all hooks rely on copy or video intros. Some hooks rely almost entirely on visuals—strong colors, contrast, or a clear offer—to grab attention without needing much copy.

The Dunkin’ ad is a good example. The hook here comes from bold visuals, high contrast colors, and an instantly recognizable offer. The bright pink background and large “$5 Promo Card” text grab attention right away, while the message is easy to understand at a glance.
There’s no confusion about what’s being offered or why you should click.
If creatives aren’t fresh, or they don’t resonate with your audience, ad fatigue will occur. Even strong hooks and formats lose impact when the same creative keeps showing to the same audience.
Creative testing is what ties all this together. When you test hooks, formats, and messaging variations consistently, patterns begin to show. You’ll learn which opening lines stop the scroll, which formats hold attention longer, and which creatives fatigue faster.
Diagnosing CTR drops with Bïrch Explorer
The next step is understanding why your CTR isn’t improving, and how to fix that with Bïrch Explorer.
Step 1: Analyze your creative performance metrics
Bïrch Explorer gives you a clear visual picture of how your ads are performing, so you can actually notice what’s working and what’s not.
Last Week’s Top Performing Creatives in the Top Assets report shows you the top performers of the last 7 days.
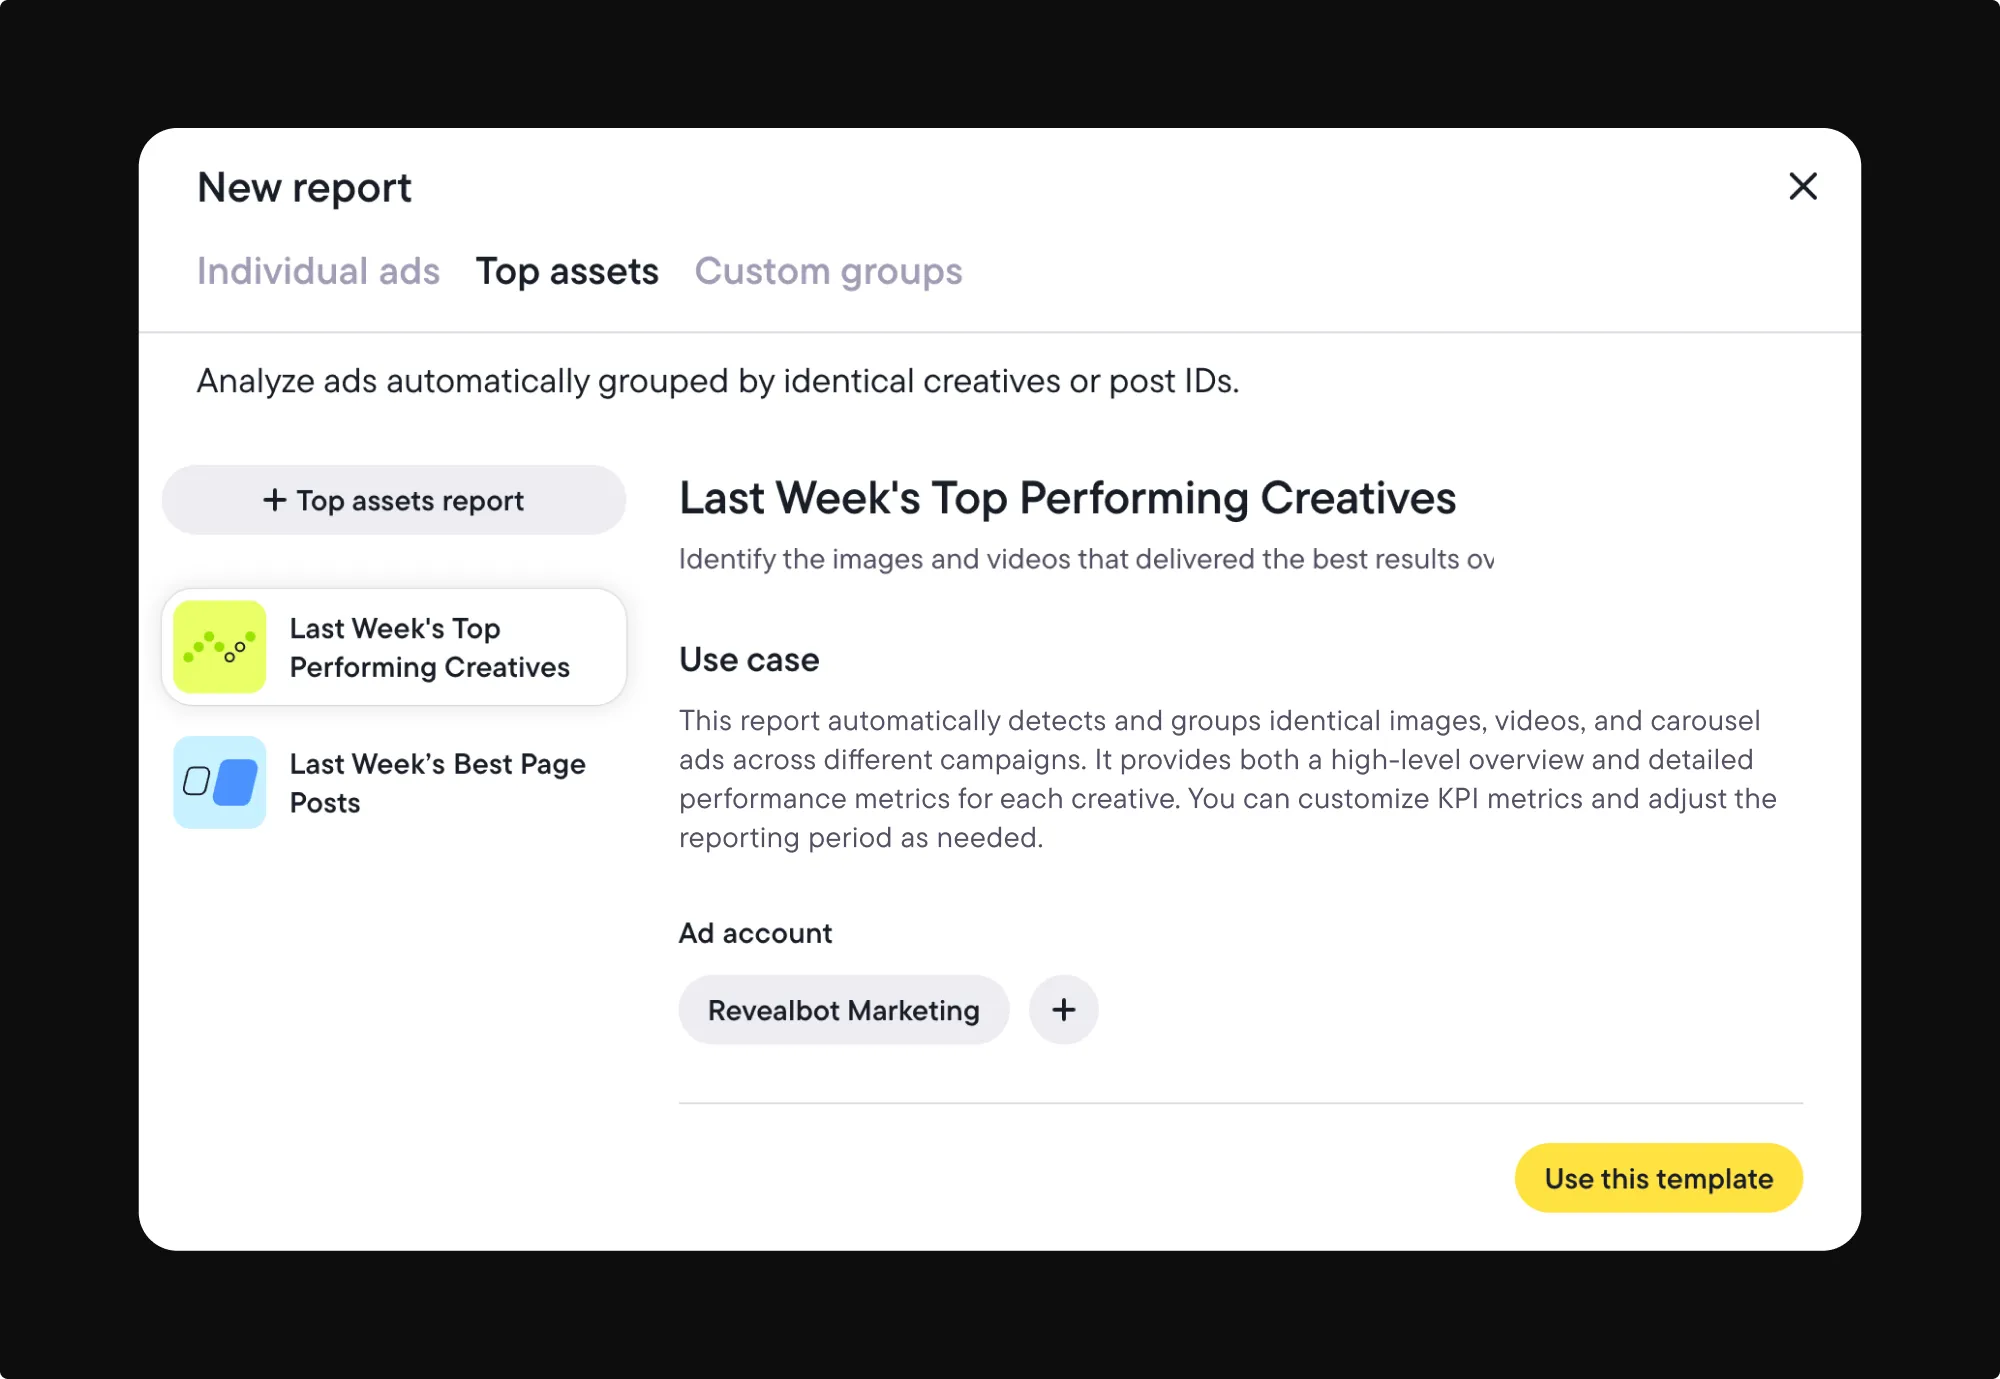
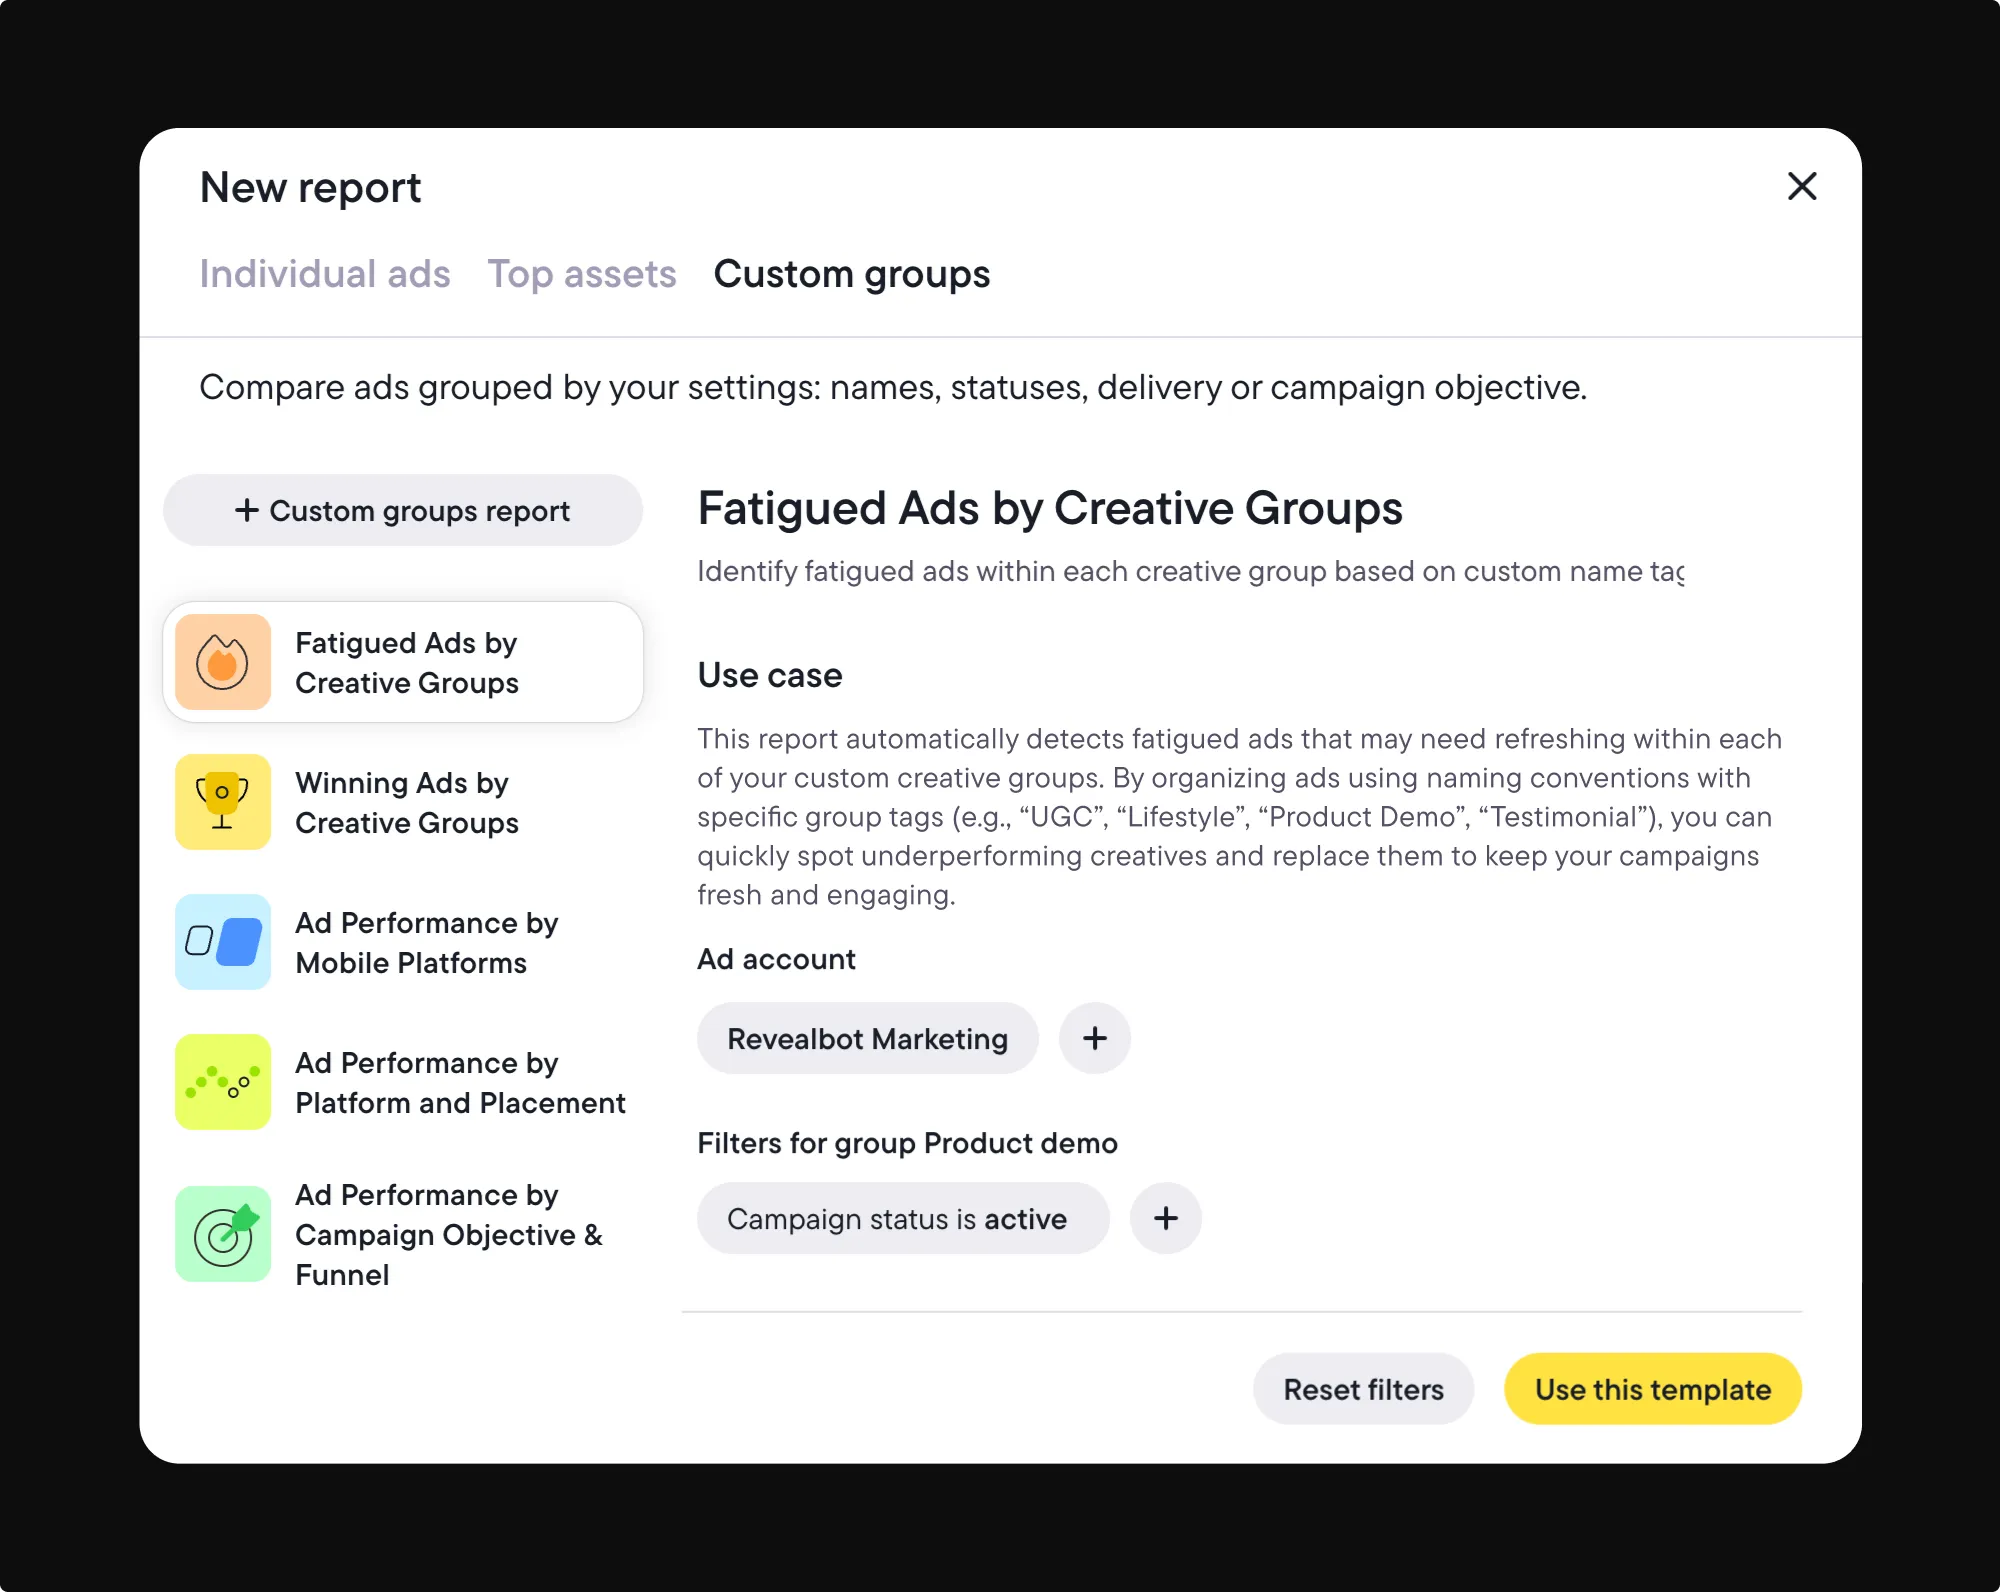
You can also find fatigue ads “on time” by switching to Fatigued Ads by Creative Groups in Custom groups.
Step 2: Identify weak hooks, formats, or messaging
Once you spot a potential issue, the next step is to find out what’s causing it.
With Explorer, creatives can be grouped by media asset, post ID, or naming conventions to see how different versions perform and compare them side-by-side. This makes it easier to identify which hooks, formats, or messaging are losing attention, compared to others.
Step 3: Benchmark against industry and platform norms
Explorer helps you benchmark creatives across industry expectations, so you can tell the difference between normal performance and genuine underperformance. A CTR that looks weak in isolation may actually be healthy for that industry or placement.
Step 4: Connect CTR issues to audience fit and fatigue
Exposure is a common reason for falling CTR. Engagement may naturally drop when the same creative keeps showing to the same audience, even if the ad initially performed well.
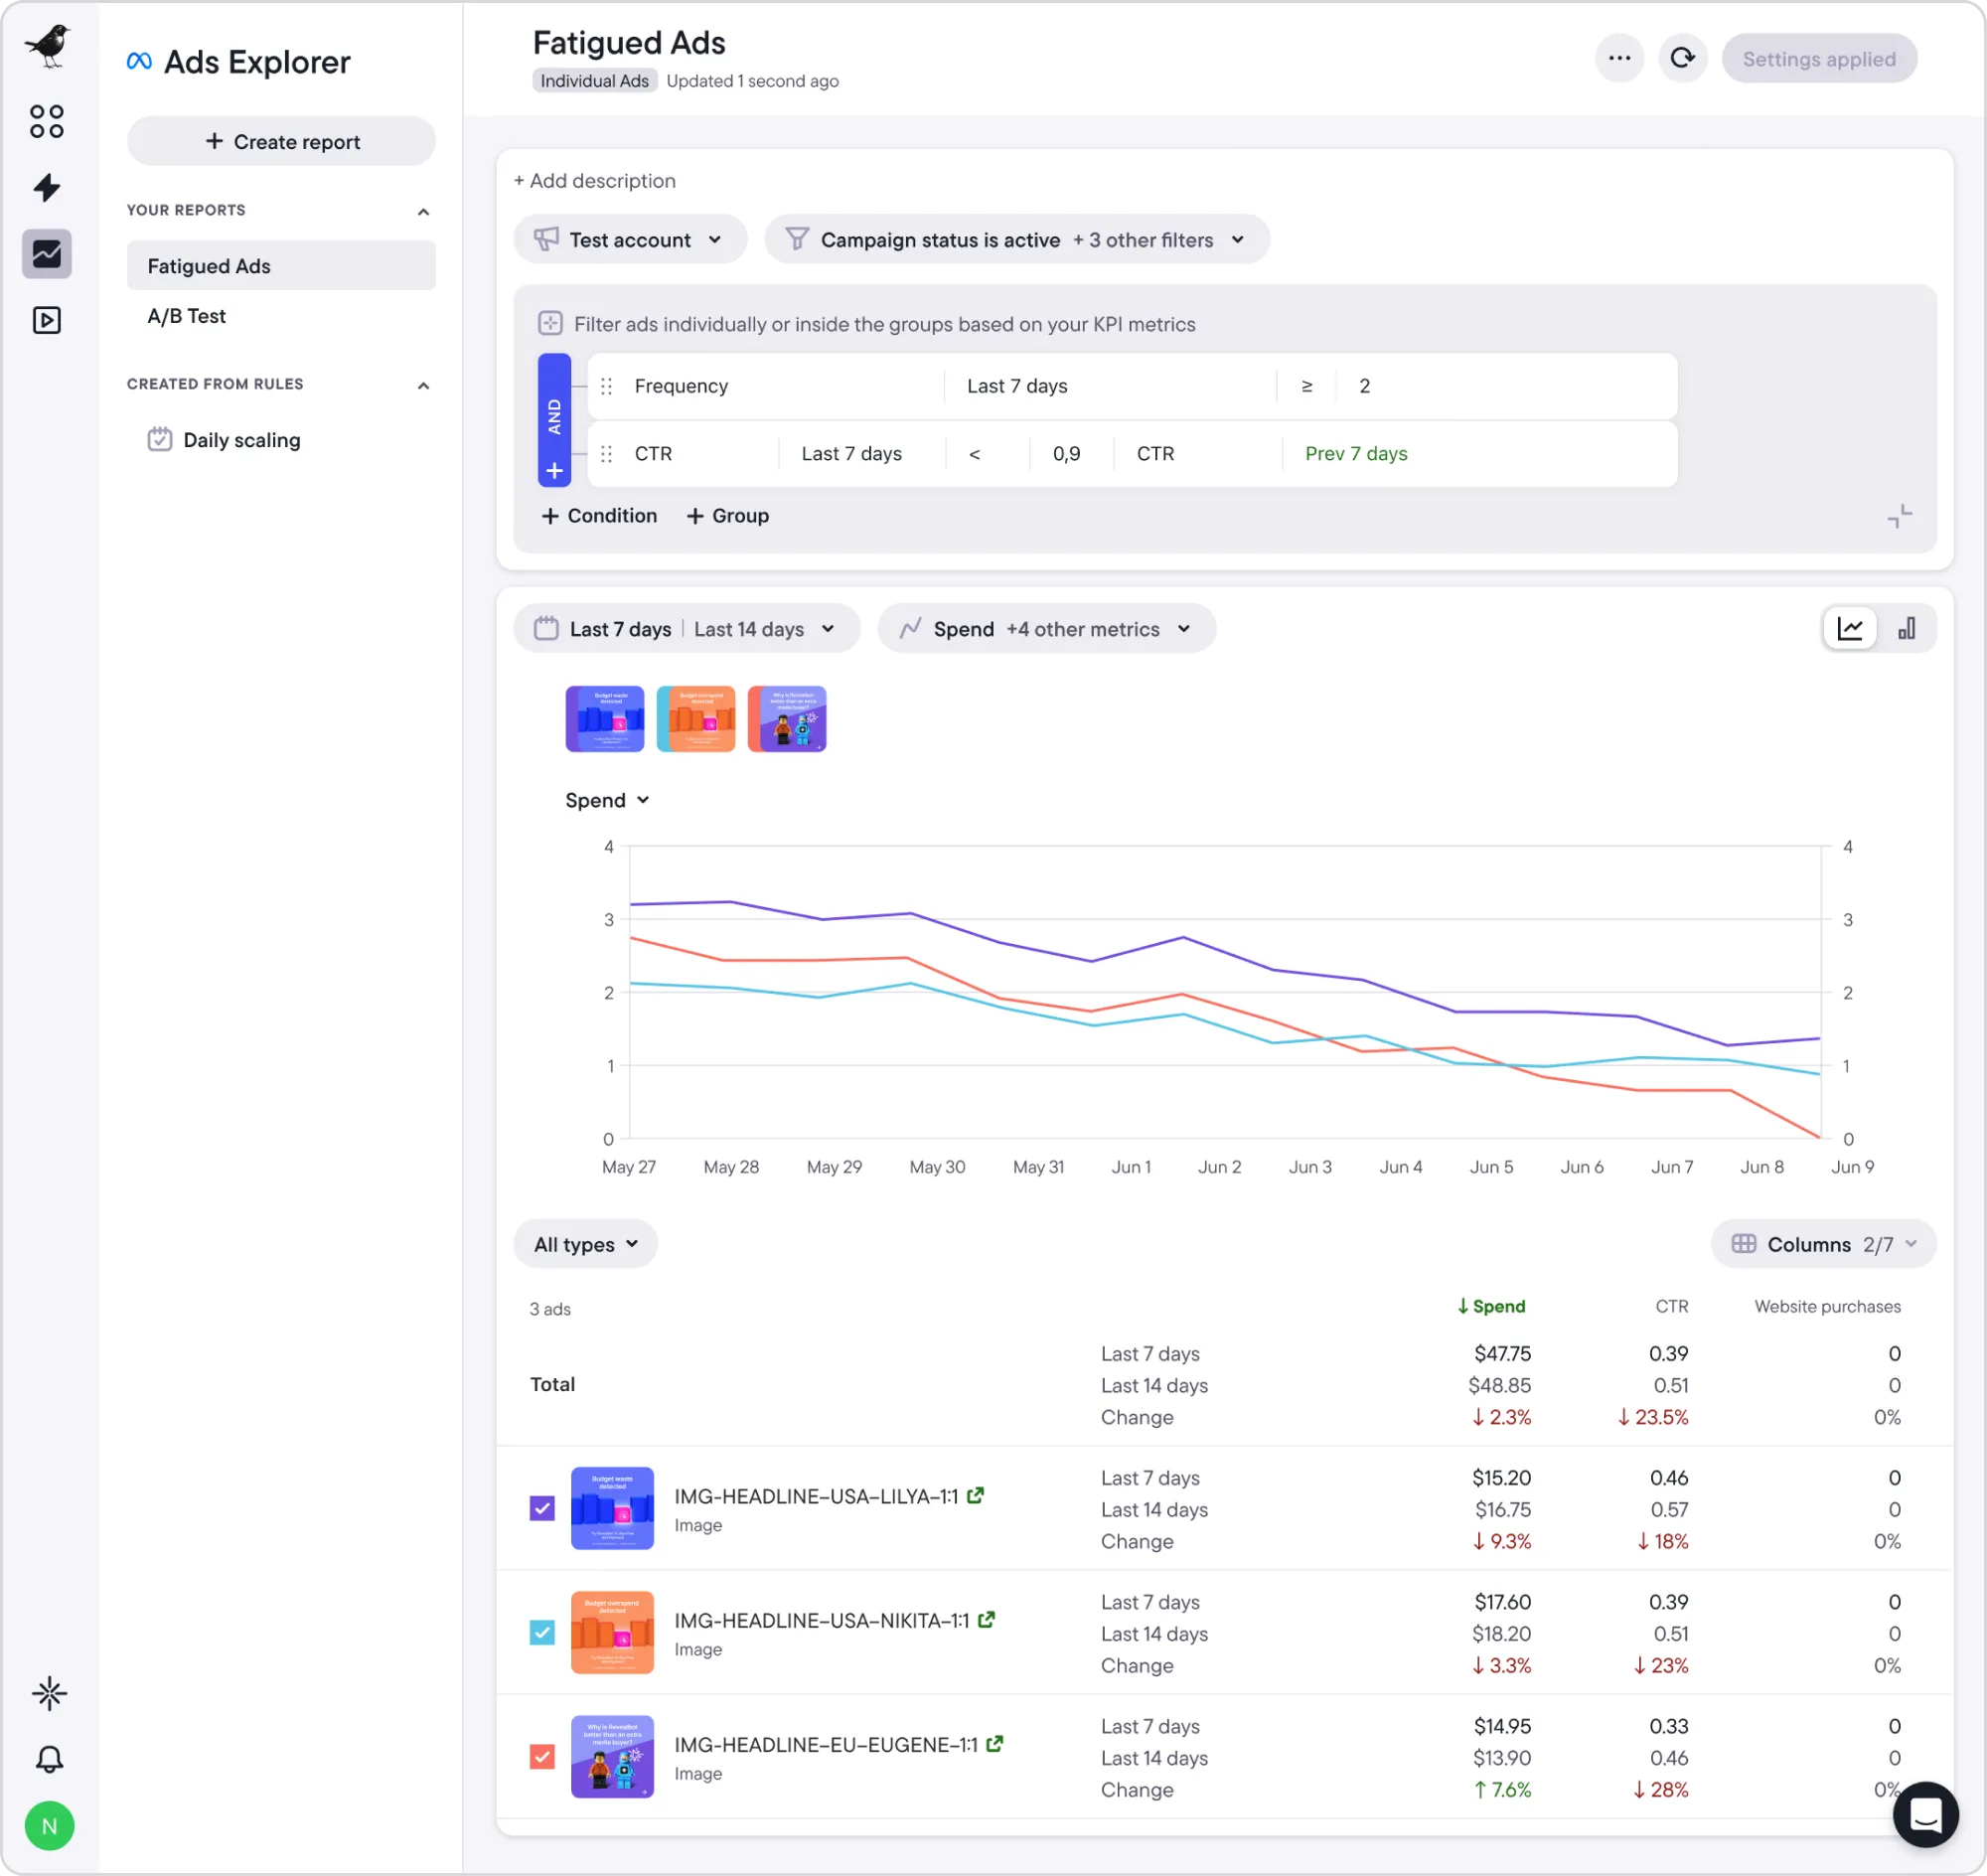
Explorer makes ad fatigue easier to spot by surfacing creatives that continue spending while CTR and downstream performance decline. This gives you an early warning to refresh, rotate, or pause ads before they drain your budget.
Fixing CTR with Bïrch: step-by-step
Now that you’ve figured out why your ads are underperforming, you have a shortlist of creatives that need attention.
You can translate the insights you get from Bïrch into high-quality, refreshed content. Use the same patterns from the ads that worked, while creating new variations and checking how CTR reacts in Explorer.
Formats and pattern interruptions often need refreshing, too. For example, if Explorer tells you static images are fatiguing faster, testing alternative formats will be a good approach—maybe short vertical videos or UGC-style content.
From there, check audience and placement fit. If a creative performs well in one segment or placement but not another, the message may be right, but the context isn’t. Explorer’s custom filters help you isolate where the drop is happening so you can adjust targeting in your ad platform or tailor new angles for specific segments.
Bïrch also helps close the loop. With custom groups, ranking conditions, and metric-based filters, you can track how refreshed variants perform against your top creatives. And if you want to automate some of the heavy lifting, rules can pause low-CTR creatives, surface fatigued assets earlier, or send alerts when performance starts slipping.
Finally, if you’re managing multiple ads and don’t have time for manual oversight, Stage and automated alerts make it easier to stay on top of new tests, track fatigue, and roll out replacements quickly.
Pro tip: Bïrch AI reads your automation rules and ad account data to surface the contradictions, the blind spots, and the setups worth doubling down on.
Advanced strategies to sustain high CTR
When CTR starts to plateau or decline, these strategies help keep performance strong over time:
Run multi-format campaigns. Different users respond to different formats, and Meta’s delivery system will automatically show each person the format they’re most likely to engage with. Running a mix of video, static, and UGC-style creatives within the same campaign helps delay fatigue and maintain CTR.
Use performance patterns—not guesses—to guide new tests. Patterns often emerge when you review CTR alongside creative elements like hooks, formats, and placements.
For example:
- Certain opening lines consistently outperform on cold audiences.
- Some formats hold attention longer before fatiguing.
- Shorter, problem-led hooks often drive faster clicks than detailed explanations.
Your team can refresh creatives strategically, changing only what needs updating, based on what the data shows.
Evaluate CTR in context. A high click-through rate only matters if it supports your broader campaign goals. In some cases, a creative with a slightly lower CTR can outperform in terms of conversion rate, CPA, or revenue.
That’s why CTR is most useful when viewed alongside:
- CPC and CPM, to understand cost efficiency
- Conversion rate, to assess traffic quality
- CPA or ROAS, to measure real business impact
Measuring and iterating for continuous CTR growth
Bïrch Explorer makes it easy to monitor all your metrics, including CTR, without getting lost in endless tables and reports.
You can:
- Track CTR over time with line charts, revealing visual trends.
- Compare different metrics side by side in bar charts (for example, CTR vs. CPC vs. spend per creative).
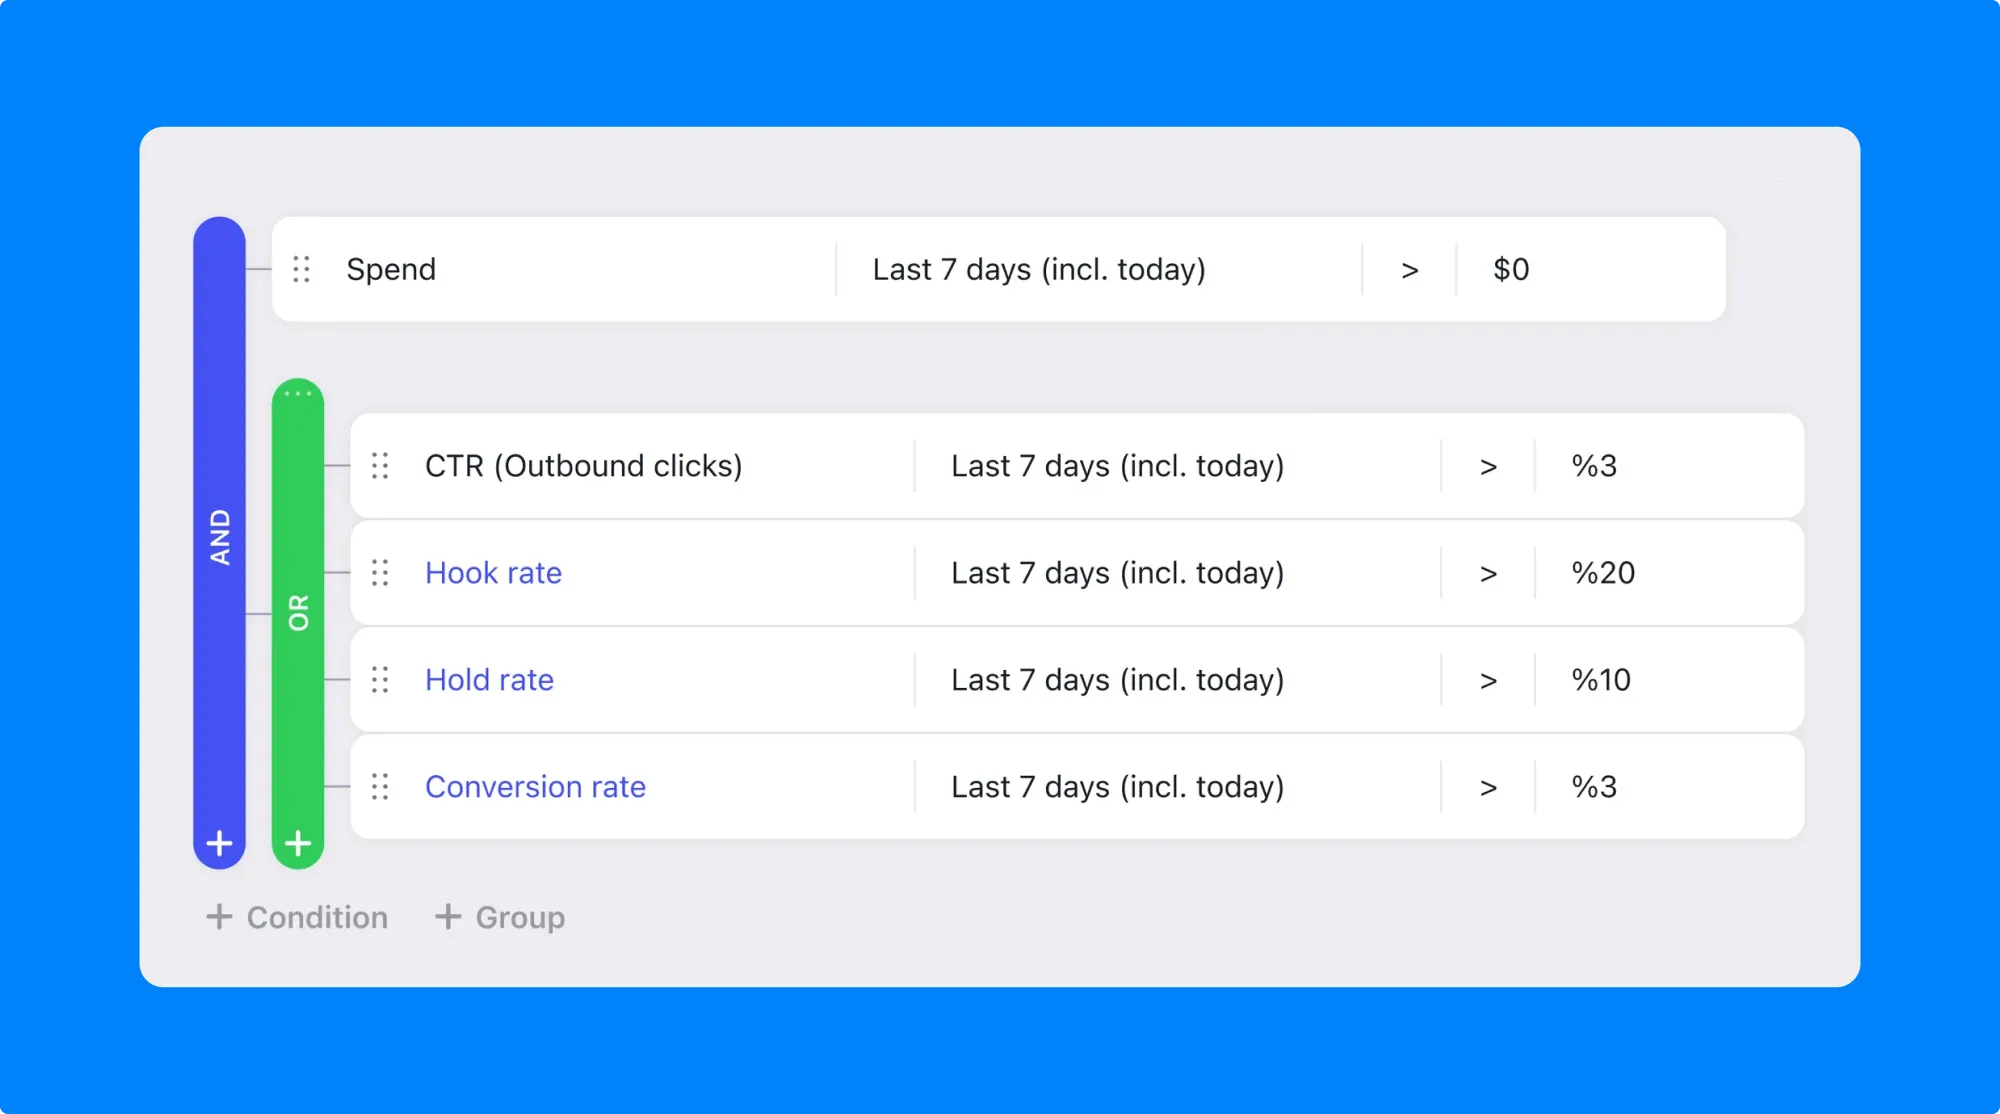
- Filter campaigns, ad sets, and ads by the KPIs you actually care about using metric conditions.
This makes it easier to answer simple but important questions, like:
- “Did CTR drop after we increased the budget?”
- “Which creatives held their CTR the longest?”
- “Are some placements quietly dragging our CTR down?”
A/B testing is also useful when you want to validate specific creative elements. Change just one thing at a time—the hook, the first frame, the headline, or the format—and compare performance. Over time, this gives you a library of patterns your brand can rely on.
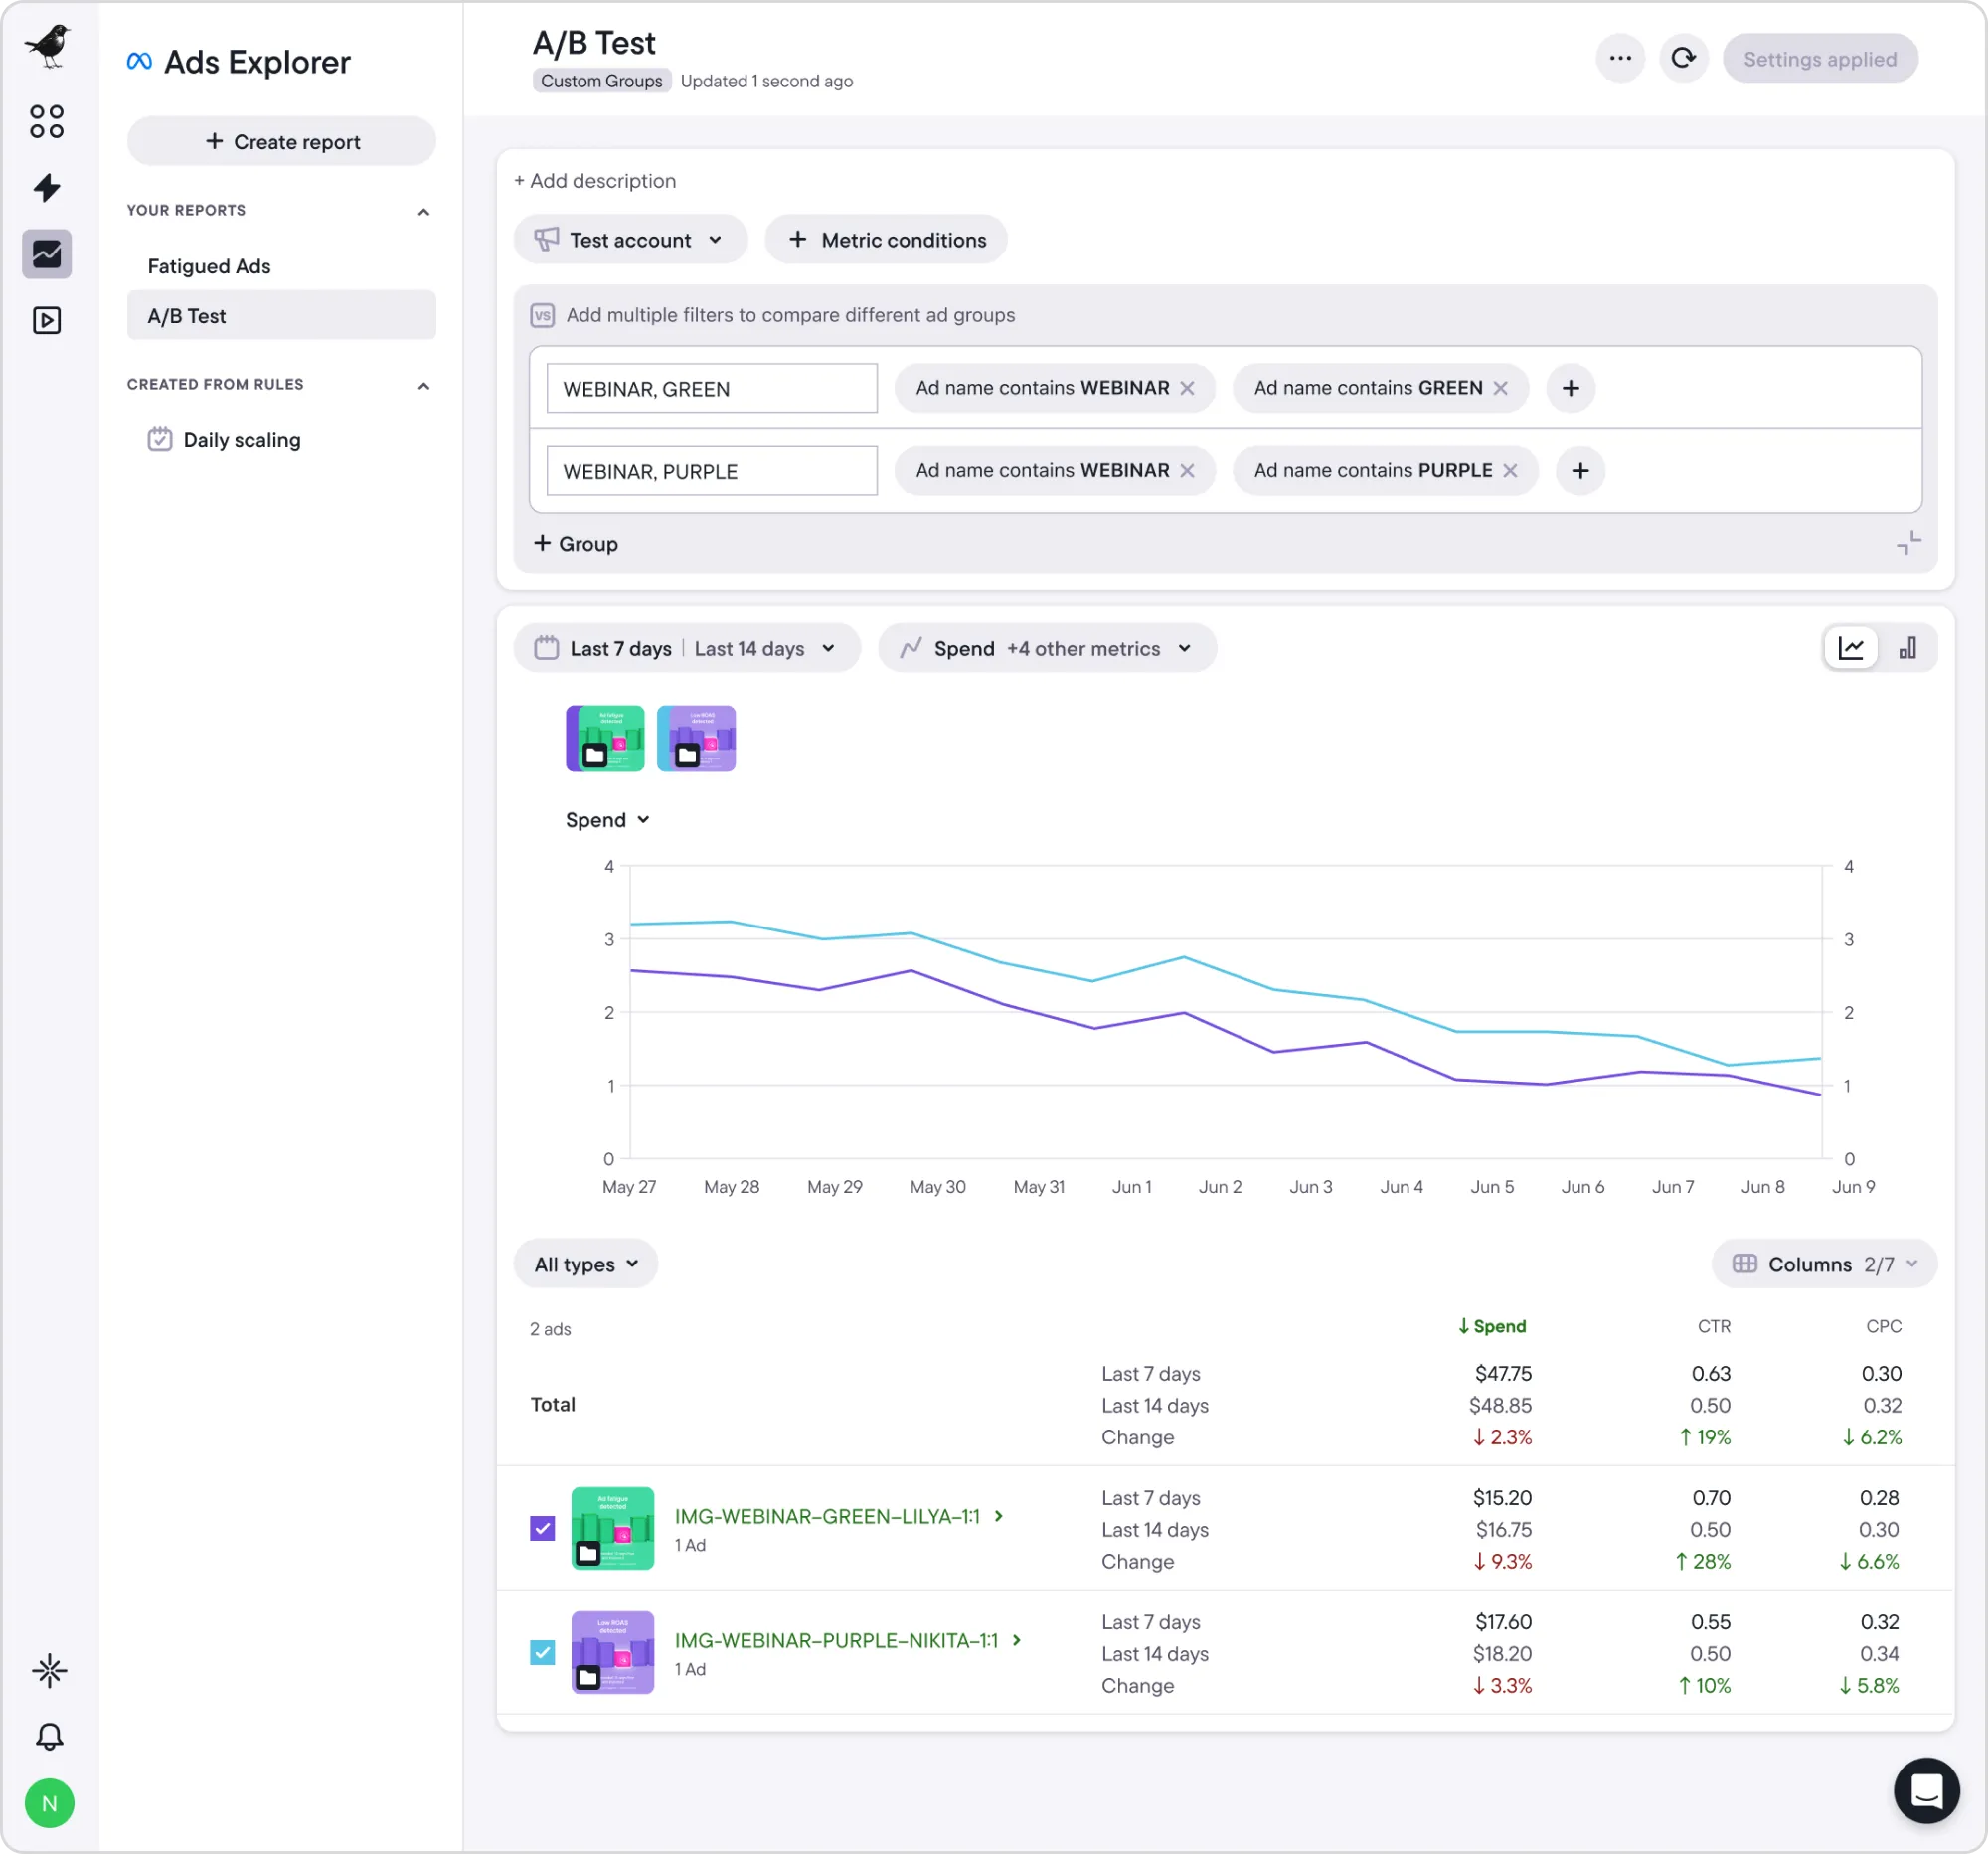
Through the Compare Creative Variations template, you can group ads by naming conventions or creative concepts (for example, different messaging angles, different hooks) and compare their performance side by side. When a variation continues spending, but its CTR trends downward, it’s a signal that fatigue is setting in.
However, CTR is never a perfectly straight line. Small ups and downs are normal, especially when budgets shift or new audiences are added.
What you’re looking for are meaningful changes, such as:
- A steady decline in CTR on a single creative—usually a sign of fatigue.
- A sudden drop right after a change in messaging or targeting—possible mismatch.
- A jump in CTR when you introduce a new hook or format—something worth scaling.
Mastering CTR as a creative metric
CTR is one of the quickest ways to understand if your ads are resonating with your audience. When it drops, it usually means fatigue, weak hooks, or misaligned messaging long before your CPA or ROAS start to slip.
The teams that improve fastest are those that treat CTR as a creative performance indicator—not a standalone metric. They read the pattern behind it. A dip tells them audience fit is weakening, fatigue is setting in, or a new angle is needed. With CTR as part of a broader creative feedback loop, you can iterate faster, spot issues earlier, and protect downstream metrics before they slip.
Bïrch Explorer gives you the visibility to do that. It shows how each creative behaves over time, surfaces fatigue early, and helps you compare variants side by side so you know exactly what to refresh, rotate, or scale. Paired with a consistent testing loop, CTR becomes predictable, actionable, and far easier to manage at scale.