Turn creative failures into a diagnostic system with Bïrch.
Can you really predict if an ad creative will succeed or fail? Debatable. Certainty isn’t generally part of the mix when it comes to creative pursuits.
Yet, beneath that unpredictability, there are certain patterns, signals, and details. These tend to be overlooked until they cause an ad campaign to fail.
But that foundational groundwork is exactly what can help you predict whether an ad succeeds or fails. If you’re managing multiple creatives across Meta, TikTok, or Google and you need to know what to test next, this preparatory work can be a big help.
This article explores the diagnostic layer of creative performance: how to read what your creative signals are actually telling you, how to isolate the variable that failed, and how to structure the next test so it gives you an answer rather than just more noise.
What makes ad creatives perform?
There’s no formula that guarantees a creative will work. But certain variables show up consistently when creatives fail. Understanding them before launch is what makes the diagnostic work that follows useful.
Is the message clear enough to act on?
One thing that consistently causes early creative failure is trying to communicate too much. When an ad is built around a single, clear message, the viewer has something to hold onto. If it tries to say three things at once, none of them will land.
This shows up most clearly when the ad is asking someone to take an action immediately.
For instance, a skincare brand running a Meta video ad that leads with “reduces redness in three days” gives the viewer a clear reason to keep watching and a clear outcome to care about. By contrast, an ad that takes too long to get to the point—or asks the viewer to piece together what it’s offering—loses attention before the message lands.
A useful test before launching any creative: if someone watches the first five seconds and nothing else, what would they take away? If you don’t have a clear answer, the message needs more focus.
Will this feel right to this audience, on this platform?
Relevance has two dimensions that are easy to conflate but worth keeping separate: audience fit and platform fit.
On the audience side, relevance goes beyond demographics. It’s about how well the creative matches what the audience expects and trusts.
In Verve’s 2025 In-App User Privacy Report, which surveyed 4,000 consumers across the US and the UK, 49% of respondents said ads mismatched to the app’s context discourage engagement. 43% said those mismatches lower their perception of the brand.
In practice, this often shows up in how the message is presented. A polished, studio-produced ad for a new skincare product might look credible, but if the audience has been conditioned to trust real-person results over brand presentation, the polish works against you.
The studio-shot ad has 1.8K views vs the UGC-style ad, which has 243K views.
On the platform side, the same creative concept can succeed on Meta and fall flat on TikTok—not because the message is wrong, but because the format doesn’t match how people use that environment.
A 60-second talking-head video might work in a Meta Feed placement where viewers are in a discovery mindset. The same video on TikTok, where native content is faster and often starts mid-story, will feel out of place. Repurposing without adapting is one of the most common and avoidable creative mistakes in performance marketing.
When we say “adapting,” we’re not just talking about cropping the video. It usually means rewriting the hook, adjusting pacing, and rethinking where the payoff lands.
Audiences have become good at recognizing when an ad is telling them something is good versus showing them why it’s good.
For DTC and e-commerce brands, proof usually means specificity: before-and-after visuals, real usage footage, customer testimonials, or data points concrete enough to be credible.
“Transforms your skin in 30 days” is a claim. A split screen of someone’s actual skin on day one and day 30 is evidence. According to Zappi’s “The state of creative effectiveness in 2025” report, emotional resonance and distinctiveness are the primary drivers of creative performance, and both are harder to achieve with generic or templated assets.
As AI-generated and overly polished content becomes more widespread, audiences are quicker to discount what feels produced and are more responsive to what feels real. That shift makes proof even more important—showing why something works carries more weight than simply claiming that it does.
Two additional variables are worth keeping in mind—but they are less about the creative itself and more about context and decay.
Timing affects how an audience receives a creative regardless of its quality. A direct-response offer for a fitness app lands differently in January than in July simply because the audience’s mindset changes. The motivation to get fit and hit personal goals usually peaks at the start of the year. Seasonal relevance and cultural moments also affect how the same message is received.
Fatigue works differently. If a creative performs well for three weeks and then fades, it may be because the same audience has seen it too many times. Catching that decay early, before it drains budget, is part of the diagnostic work covered in the next section.
Every creative runs through a chain of attention moments. Each one either holds or breaks. The metrics, in a sense, give you a map you can follow to spot the exact moment attention slips.
The attention chain framework
Step 1: Did the first frame earn a pause?
Metric:Thumb-stop rate (also called hook rate on some platforms)
This tells you whether the opening frame stopped the scroll. If this metric is low, the issue is the first 1–2 seconds of the creative.
It’s worth looking at one of these elements:
The visual
The motion
The text overlay
The audio
Most other creative decisions may be secondary until this is addressed.
Diagnostic question: Is the opening frame visually distinct? Does it immediately signal relevance to the target audience? Does it create a reason to keep watching?
Step 2: Did the hook hold attention through the body?
Metric: Hold rate (percentage of viewers who watch through a defined point, often 25–50% of the video)
A strong thumb-stop rate with a collapsing hold rate usually means the hook made a promise the body of the creative didn’t keep. The viewer stopped, started watching, and left when the content didn’t deliver.
Diagnostic question: Does the transition from hook to message feel continuous? Or does it feel like a different ad has started?
Step 3: Did the message hold through to the end?
Metric: Watch time/video completion rate
This is the middle section of the creative where most of the ad’s message lives.
Drop-off here often signals that the pacing is too slow, the information is too dense, or the viewer has already decided whether they are interested.
Diagnostic question: Is the middle section earning its runtime? Is each moment either building the case or sustaining interest, or is there a point where the viewer has nothing left to wait for?
Step 4: Did the viewer take action?
Metric:CTR
This is the decision point. The viewer watched, then they either acted or they didn’t.
Low CTR after strong watch time usually means the offer wasn’t compelling enough, the CTA wasn’t clear, or there was a mismatch between what the creative built up and what it asked for at the end.
Diagnostic question: Is the CTA visible and specific? Does the offer feel like a natural payoff for what the creative built, or does it ask for something the viewer wasn't primed to give?
Step 5: Did the post-click experience close the loop?
Metric:Conversion rate
Strong engagement with weak conversions is a landing page problem, not a creative problem. The ad worked. What happened after the click didn’t.
It’s important to understand this before running another creative test. If the conversion problem is off-platform, changing the creative won’t fix it.
Diagnostic question:Does the landing page reflect what the ad promised? Would a viewer arriving from this specific creative immediately feel they are in the right place?
Bïrch Explorer
How to do this in Bïrch Explorer:Explorer surfaces hook rate, hold rate, CTR, and conversion rate together at the individual ad level. Because these metrics are displayed in sequence, you can read them as a chain: each number tells you how far the viewer got and where they dropped off. That’s what makes it practical for this kind of diagnostic—instead of investigating metrics one at a time, you can see the full attention arc of a single ad in one view.
Isolating the creative variable
Changing too many things at once to uncover the issue is one of the most common diagnostic errors. If a creative fails and you rebuild it with a new hook, format, copy, and offer, it can be difficult to know what actually failed.
The diagnostic process tends to work best when it isolates variables. That means deciding beforehand whether you’re testing:
Hook style (pattern interrupt vs. social proof vs. curiosity gap)
Proof mechanism (testimonial vs. before/after vs. data)
Format (UGC-style vs. studio-shot vs. static creative)
Offer framing (discount vs. urgency vs. exclusivity)
The idea is to change one thing, then measure the impact. It’s difficult to tell which variable moved the needle if you test the hook style and proof mechanism at the same time.
If you can’t write a one-sentence description of what variable this test is measuring, the test isn’t streamlined enough.
Forming a testable hypothesis
Ideally, every diagnosis leads to a specific hypothesis, not just a general intention. That distinction can make a real difference.
A general intention: “We should test a stronger hook.”
A testable hypothesis: “Engagement dropped off at five seconds in our last three video creatives. Our hypothesis is that the value prop isn’t surfacing early enough. We’re going to test leading with the benefit in the first three seconds rather than building to it.”
The second version tells you what to change, why, and what a positive result would look like. That’s what makes repetition compound.
How to do this in Bïrch Stage: Once you have a hypothesis, use Stage to set up both the control and the test version with identical targeting parameters. Run them side by side and compare results in Explorer without manually pulling data from multiple sources.
Learning from failed creatives
The most productive post-mortem starts by asking: where exactly did the viewer disengage? Aim to identify the moment in the attention chain and what creative decision likely caused it—not why the ad broadly failed.
Below is a hypothetical example based on a realistic DTC scenario.
The scenario:
A subscription skincare brand runs a 30-second UGC-style video ad on Meta. The creative opens with an influencer applying serum and speaking directly to the camera. After three days, the data looks like this:
Thumb-stop rate: 28% (solid)
Hold rate at 25%: 41% (above average)
Hold rate at 75%: 9% (sharp drop)
CTR: 0.6% (below expected for a warm audience)
Conversion rate: decent (suggesting the landing page is fine)
What the attention chain tells you:
The opening is working. People are stopping. They’re also watching through the first third.
But something in the middle of the video causes a significant drop before the CTA lands. The CTR is low, not because the offer is bad, but because most viewers never reach it.
Hypothesis:
“The creator transitions into product explanation around the 12-second mark. Our hypothesis is that this shift feels like a pitch rather than a continuation of the story, and viewers disengage before the benefit is fully communicated. We’ll test a version where the product payoff is woven into the narrative rather than separated from it.”
The test:
Rescript the middle section so the product benefit appears as part of the creator’s story rather than as a feature explanation. Isolate that one variable, keeping everything else the same.
Launch both versions through Stage with identical parameters. Compare hold rates at 75% and CTR after five days.
What this loop produces:
If the hypothesis is right, the new version will show improved hold at 75% and a higher CTR. If it’s wrong, the drop will remain, and you’ll need to reconsider whether the issue is pacing, audience fit, or the offer itself. Either way, you will have answered your hypothesis.
This is the difference between creative iteration and creative guessing. The loop is:
Identify the breakdown point → map it to a specific variable → form a hypothesis → change one thing → measure.
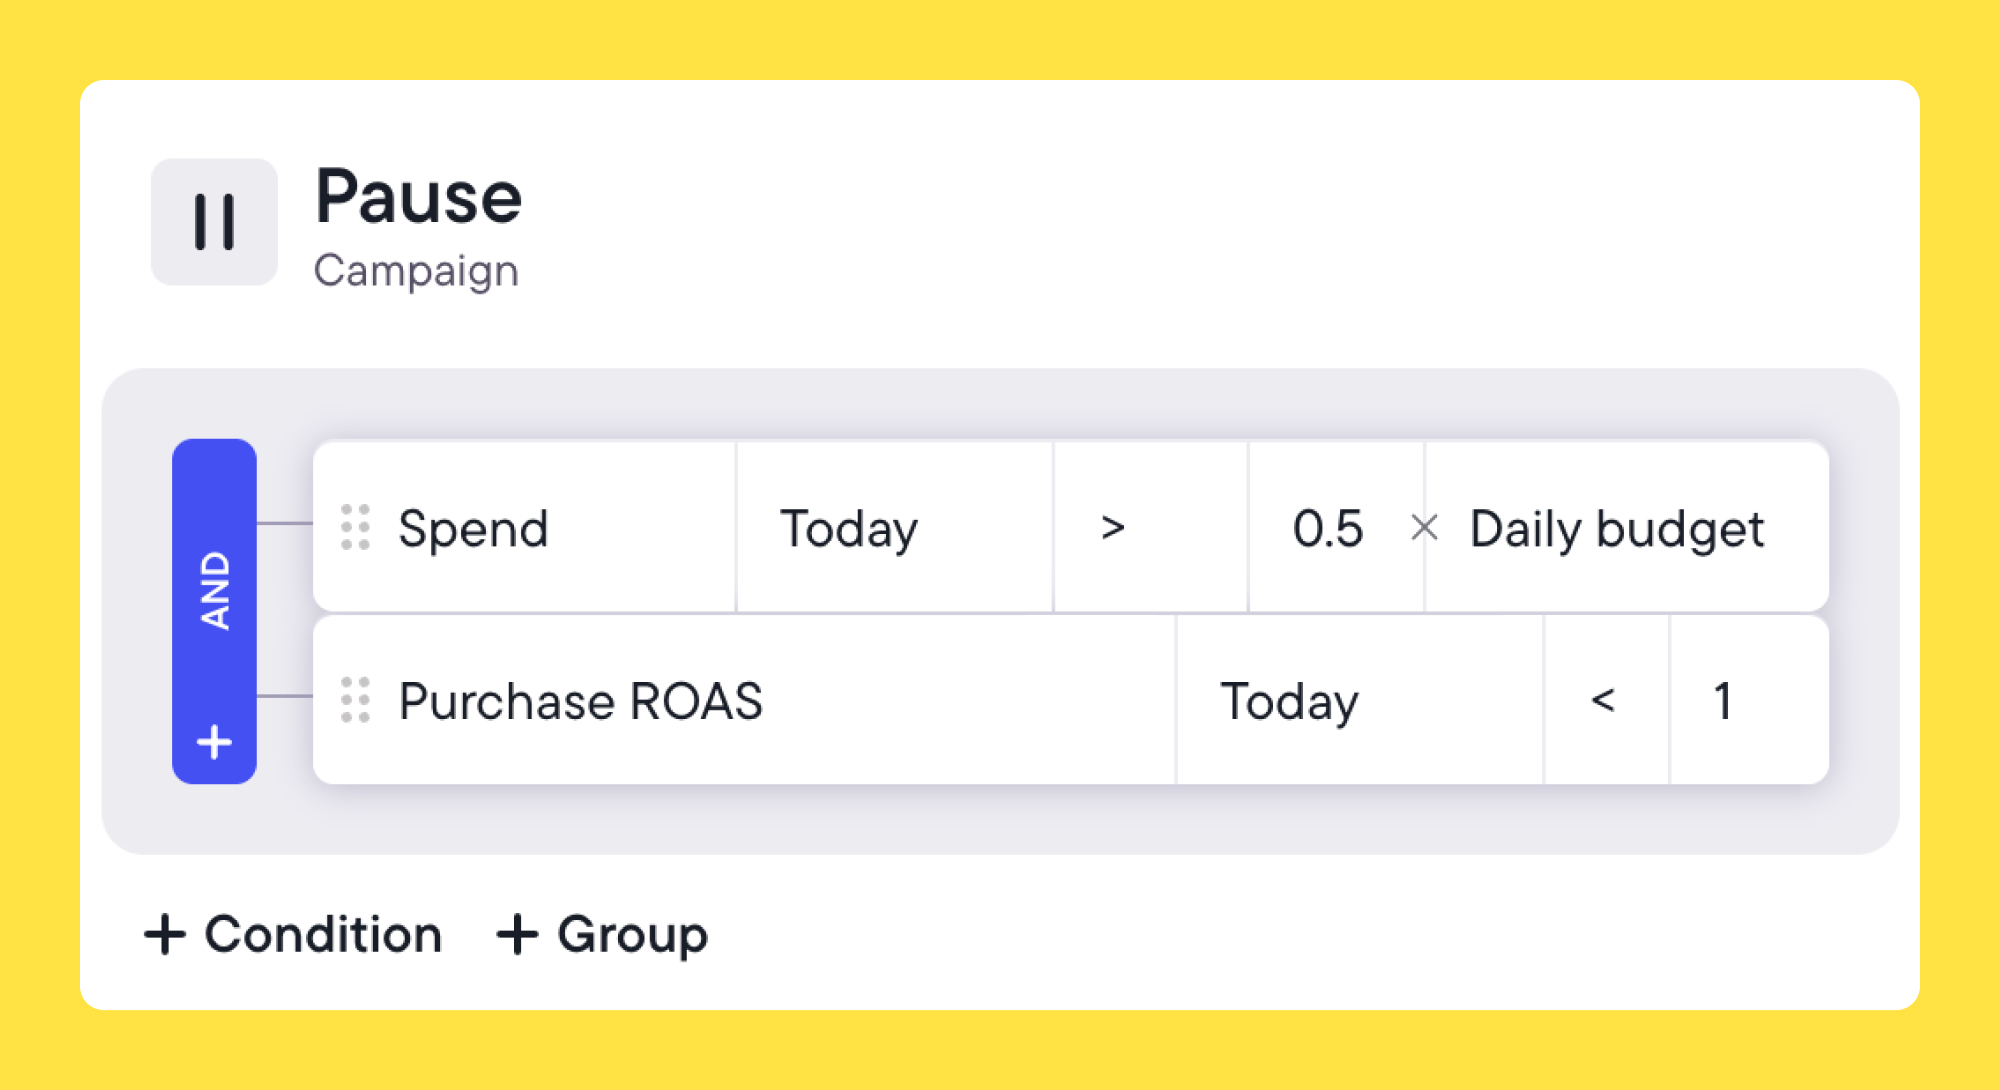
Bïrch auto-pause feature
Spotting this in Bïrch: Explorer’s Downtrend template flags ads with declining purchase and conversion rates over 14 days. This is useful data for catching gradual decay before it becomes a budget problem. Pair this with the auto-pause feature to stop spending on underperforming creatives without manual monitoring.
Creative performance is unpredictable, but the testing part doesn’t have to be
You can’t know for certain what creative will resonate with an audience before it runs. But you can structure your testing so that each failed creative teaches you something about why it did.
That means reading the attention chain in order, isolating variables before testing them, and forming hypotheses you can clearly confirm or reject.
We built Bïrch Explorer and Stage to make this diagnostic workflow faster and cleaner, so instead of pulling data manually across multiple platforms, you can spot patterns in one place and act on them immediately.
Turn creative failures into a diagnostic system with Bïrch.
Can you really predict if an ad creative will succeed or fail? Debatable. Certainty isn’t generally part of the mix when it comes to creative pursuits.
Yet, beneath that unpredictability, there are certain patterns, signals, and details. These tend to be overlooked until they cause an ad campaign to fail.
But that foundational groundwork is exactly what can help you predict whether an ad succeeds or fails. If you’re managing multiple creatives across Meta, TikTok, or Google and you need to know what to test next, this preparatory work can be a big help.
This article explores the diagnostic layer of creative performance: how to read what your creative signals are actually telling you, how to isolate the variable that failed, and how to structure the next test so it gives you an answer rather than just more noise.
What makes ad creatives perform?
There’s no formula that guarantees a creative will work. But certain variables show up consistently when creatives fail. Understanding them before launch is what makes the diagnostic work that follows useful.
Is the message clear enough to act on?
One thing that consistently causes early creative failure is trying to communicate too much. When an ad is built around a single, clear message, the viewer has something to hold onto. If it tries to say three things at once, none of them will land.
This shows up most clearly when the ad is asking someone to take an action immediately.
For instance, a skincare brand running a Meta video ad that leads with “reduces redness in three days” gives the viewer a clear reason to keep watching and a clear outcome to care about. By contrast, an ad that takes too long to get to the point—or asks the viewer to piece together what it’s offering—loses attention before the message lands.
A useful test before launching any creative: if someone watches the first five seconds and nothing else, what would they take away? If you don’t have a clear answer, the message needs more focus.
Will this feel right to this audience, on this platform?
Relevance has two dimensions that are easy to conflate but worth keeping separate: audience fit and platform fit.
On the audience side, relevance goes beyond demographics. It’s about how well the creative matches what the audience expects and trusts.
In Verve’s 2025 In-App User Privacy Report, which surveyed 4,000 consumers across the US and the UK, 49% of respondents said ads mismatched to the app’s context discourage engagement. 43% said those mismatches lower their perception of the brand.
In practice, this often shows up in how the message is presented. A polished, studio-produced ad for a new skincare product might look credible, but if the audience has been conditioned to trust real-person results over brand presentation, the polish works against you.
The studio-shot ad has 1.8K views vs the UGC-style ad, which has 243K views.
On the platform side, the same creative concept can succeed on Meta and fall flat on TikTok—not because the message is wrong, but because the format doesn’t match how people use that environment.
A 60-second talking-head video might work in a Meta Feed placement where viewers are in a discovery mindset. The same video on TikTok, where native content is faster and often starts mid-story, will feel out of place. Repurposing without adapting is one of the most common and avoidable creative mistakes in performance marketing.
When we say “adapting,” we’re not just talking about cropping the video. It usually means rewriting the hook, adjusting pacing, and rethinking where the payoff lands.
Audiences have become good at recognizing when an ad is telling them something is good versus showing them why it’s good.
For DTC and e-commerce brands, proof usually means specificity: before-and-after visuals, real usage footage, customer testimonials, or data points concrete enough to be credible.
“Transforms your skin in 30 days” is a claim. A split screen of someone’s actual skin on day one and day 30 is evidence. According to Zappi’s “The state of creative effectiveness in 2025” report, emotional resonance and distinctiveness are the primary drivers of creative performance, and both are harder to achieve with generic or templated assets.
As AI-generated and overly polished content becomes more widespread, audiences are quicker to discount what feels produced and are more responsive to what feels real. That shift makes proof even more important—showing why something works carries more weight than simply claiming that it does.
Two additional variables are worth keeping in mind—but they are less about the creative itself and more about context and decay.
Timing affects how an audience receives a creative regardless of its quality. A direct-response offer for a fitness app lands differently in January than in July simply because the audience’s mindset changes. The motivation to get fit and hit personal goals usually peaks at the start of the year. Seasonal relevance and cultural moments also affect how the same message is received.
Fatigue works differently. If a creative performs well for three weeks and then fades, it may be because the same audience has seen it too many times. Catching that decay early, before it drains budget, is part of the diagnostic work covered in the next section.
Every creative runs through a chain of attention moments. Each one either holds or breaks. The metrics, in a sense, give you a map you can follow to spot the exact moment attention slips.
The attention chain framework
Step 1: Did the first frame earn a pause?
Metric:Thumb-stop rate (also called hook rate on some platforms)
This tells you whether the opening frame stopped the scroll. If this metric is low, the issue is the first 1–2 seconds of the creative.
It’s worth looking at one of these elements:
The visual
The motion
The text overlay
The audio
Most other creative decisions may be secondary until this is addressed.
Diagnostic question: Is the opening frame visually distinct? Does it immediately signal relevance to the target audience? Does it create a reason to keep watching?
Step 2: Did the hook hold attention through the body?
Metric: Hold rate (percentage of viewers who watch through a defined point, often 25–50% of the video)
A strong thumb-stop rate with a collapsing hold rate usually means the hook made a promise the body of the creative didn’t keep. The viewer stopped, started watching, and left when the content didn’t deliver.
Diagnostic question: Does the transition from hook to message feel continuous? Or does it feel like a different ad has started?
Step 3: Did the message hold through to the end?
Metric: Watch time/video completion rate
This is the middle section of the creative where most of the ad’s message lives.
Drop-off here often signals that the pacing is too slow, the information is too dense, or the viewer has already decided whether they are interested.
Diagnostic question: Is the middle section earning its runtime? Is each moment either building the case or sustaining interest, or is there a point where the viewer has nothing left to wait for?
Step 4: Did the viewer take action?
Metric:CTR
This is the decision point. The viewer watched, then they either acted or they didn’t.
Low CTR after strong watch time usually means the offer wasn’t compelling enough, the CTA wasn’t clear, or there was a mismatch between what the creative built up and what it asked for at the end.
Diagnostic question: Is the CTA visible and specific? Does the offer feel like a natural payoff for what the creative built, or does it ask for something the viewer wasn't primed to give?
Step 5: Did the post-click experience close the loop?
Metric:Conversion rate
Strong engagement with weak conversions is a landing page problem, not a creative problem. The ad worked. What happened after the click didn’t.
It’s important to understand this before running another creative test. If the conversion problem is off-platform, changing the creative won’t fix it.
Diagnostic question:Does the landing page reflect what the ad promised? Would a viewer arriving from this specific creative immediately feel they are in the right place?
Bïrch Explorer
How to do this in Bïrch Explorer:Explorer surfaces hook rate, hold rate, CTR, and conversion rate together at the individual ad level. Because these metrics are displayed in sequence, you can read them as a chain: each number tells you how far the viewer got and where they dropped off. That’s what makes it practical for this kind of diagnostic—instead of investigating metrics one at a time, you can see the full attention arc of a single ad in one view.
Isolating the creative variable
Changing too many things at once to uncover the issue is one of the most common diagnostic errors. If a creative fails and you rebuild it with a new hook, format, copy, and offer, it can be difficult to know what actually failed.
The diagnostic process tends to work best when it isolates variables. That means deciding beforehand whether you’re testing:
Hook style (pattern interrupt vs. social proof vs. curiosity gap)
Proof mechanism (testimonial vs. before/after vs. data)
Format (UGC-style vs. studio-shot vs. static creative)
Offer framing (discount vs. urgency vs. exclusivity)
The idea is to change one thing, then measure the impact. It’s difficult to tell which variable moved the needle if you test the hook style and proof mechanism at the same time.
If you can’t write a one-sentence description of what variable this test is measuring, the test isn’t streamlined enough.
Forming a testable hypothesis
Ideally, every diagnosis leads to a specific hypothesis, not just a general intention. That distinction can make a real difference.
A general intention: “We should test a stronger hook.”
A testable hypothesis: “Engagement dropped off at five seconds in our last three video creatives. Our hypothesis is that the value prop isn’t surfacing early enough. We’re going to test leading with the benefit in the first three seconds rather than building to it.”
The second version tells you what to change, why, and what a positive result would look like. That’s what makes repetition compound.
How to do this in Bïrch Stage: Once you have a hypothesis, use Stage to set up both the control and the test version with identical targeting parameters. Run them side by side and compare results in Explorer without manually pulling data from multiple sources.
Learning from failed creatives
The most productive post-mortem starts by asking: where exactly did the viewer disengage? Aim to identify the moment in the attention chain and what creative decision likely caused it—not why the ad broadly failed.
Below is a hypothetical example based on a realistic DTC scenario.
The scenario:
A subscription skincare brand runs a 30-second UGC-style video ad on Meta. The creative opens with an influencer applying serum and speaking directly to the camera. After three days, the data looks like this:
Thumb-stop rate: 28% (solid)
Hold rate at 25%: 41% (above average)
Hold rate at 75%: 9% (sharp drop)
CTR: 0.6% (below expected for a warm audience)
Conversion rate: decent (suggesting the landing page is fine)
What the attention chain tells you:
The opening is working. People are stopping. They’re also watching through the first third.
But something in the middle of the video causes a significant drop before the CTA lands. The CTR is low, not because the offer is bad, but because most viewers never reach it.
Hypothesis:
“The creator transitions into product explanation around the 12-second mark. Our hypothesis is that this shift feels like a pitch rather than a continuation of the story, and viewers disengage before the benefit is fully communicated. We’ll test a version where the product payoff is woven into the narrative rather than separated from it.”
The test:
Rescript the middle section so the product benefit appears as part of the creator’s story rather than as a feature explanation. Isolate that one variable, keeping everything else the same.
Launch both versions through Stage with identical parameters. Compare hold rates at 75% and CTR after five days.
What this loop produces:
If the hypothesis is right, the new version will show improved hold at 75% and a higher CTR. If it’s wrong, the drop will remain, and you’ll need to reconsider whether the issue is pacing, audience fit, or the offer itself. Either way, you will have answered your hypothesis.
This is the difference between creative iteration and creative guessing. The loop is:
Identify the breakdown point → map it to a specific variable → form a hypothesis → change one thing → measure.
Bïrch auto-pause feature
Spotting this in Bïrch: Explorer’s Downtrend template flags ads with declining purchase and conversion rates over 14 days. This is useful data for catching gradual decay before it becomes a budget problem. Pair this with the auto-pause feature to stop spending on underperforming creatives without manual monitoring.
Creative performance is unpredictable, but the testing part doesn’t have to be
You can’t know for certain what creative will resonate with an audience before it runs. But you can structure your testing so that each failed creative teaches you something about why it did.
That means reading the attention chain in order, isolating variables before testing them, and forming hypotheses you can clearly confirm or reject.
We built Bïrch Explorer and Stage to make this diagnostic workflow faster and cleaner, so instead of pulling data manually across multiple platforms, you can spot patterns in one place and act on them immediately.
What’s the difference between creative performance and ad performance?
Ad performance covers delivery and efficiency: CPM, reach, and ROAS. Creative performance measures how well the asset itself (the video, image, copy, or hook) does its job once someone sees it. Conflating the two leads to the wrong fixes.
Which metric should I look at first when a creative underperforms?
Start with the thumb-stop rate. If the opening frame doesn’t earn a pause, nothing else gets a chance to work. Work through the chain from there: hold rate, watch time, CTR, conversion rate. Your diagnosis starts from where the first metric significantly drops.
How do I know if a low CTR is a creative problem or an offer problem?
Check watch time first. If watch time is strong but CTR is low, the creative is doing its job. The offer or CTA may be the issue. If watch time is also low, the creative is the problem, and viewers aren’t getting to the offer.
How many variables should I test at once?
One. If you change the hook, format, and offer framing simultaneously, you won’t know which variable made a difference. Test one variable per iteration, and make sure you can write a one-sentence description of what the test is measuring before you launch it.
What’s the right way to structure a creative hypothesis?
A good hypothesis names the metric, drop-off point, suspected cause, and proposed fix. Example: “Hold rate collapses at the 12-second mark. Hypothesis: the transition to product explanation feels like a pivot rather than a continuation of the story. Test: rewrite the middle section to keep the narrative continuous through the product reveal.”
When should I pause a creative and test something new vs. iterate on what’s live?
If the thumb-stop rate is strong but something in the middle is breaking down, iteration is worth trying because the hook is already working. If the thumb-stop rate itself is low, starting fresh with a new opening is usually faster than trying to fix what’s there. Bïrch Explorer’s Fatigued Ads template helps flag the right moment to rotate based on frequency and CTR patterns.
Flogerta Lesi
Flogerta Lesi is a freelance writer and content strategist specializing in copywriting, ghostwriting, and LinkedIn growth. A contributor to the Bïrch Blog with a background spanning fintech, branding, and digital advertising, she helps businesses and individuals build their online presence. She also hosts "Zëri Zanatit," a podcast on freelancing and personal branding.