Spending too much time stitching together creative reports in Ads Manager? Try Bïrch free for 14 days.
You open Ads Manager to review how your creatives are performing, but the results you're looking for are spread across multiple campaigns. So you jump between campaign reports, apply filters, and export data just to compare how the same creative performed across tests.
This is a structural issue many teams face. Because Meta Ads Manager reports performance at the campaign level, creative results are siloed. When it's time to analyze, you're manually piecing together data across multiple campaigns—ultimately slowing down creative testing. Here's where that breaks down, and what Bïrch does differently.
Where Meta Ads Manager falls short for creative performance analysis
As creative testing scales, analyzing performance inside Ads Manager becomes harder to manage. Teams often end up piecing together insights across campaigns, reports, and exports just to understand what’s actually working.

For performance teams, this creates several limitations:
- Fragmented reporting: Creative performance is split across campaigns and ad sets. To see how the same creative actually performed across tests, teams resort to exporting reports, stitching data together, and comparing results manually.
- Reporting limitations: Performance teams often rely on custom KPIs and internal reporting frameworks built over years of testing. Ads Manager reporting is tied to its own metrics and structure, which makes it harder to analyze creative performance using the parameters your team actually works with.
- Automation limitations: Ads Manager offers basic automated rules, but they’re mostly tied to simple campaign actions. When it comes to creative analysis, automation is limited. Teams can’t easily set up continuous monitoring or get alerts when creative performance crosses important thresholds, so spotting those changes often comes down to manually checking reports.
Ads Manager vs Bïrch: creative analysis workflows compared
Those limitations show up in three specific workflows every performance team runs.
Analyzing a new creative launch
In Ads Manager
You review performance inside the campaign where the ads are running, comparing CTR, CPA, and ROAS across ads and applying breakdowns when needed. If the same creative appears in multiple campaigns, you’ll need to build custom reports or export data. This approach is what enables you to aggregate results and evaluate creative performance across those campaigns.
In Bïrch
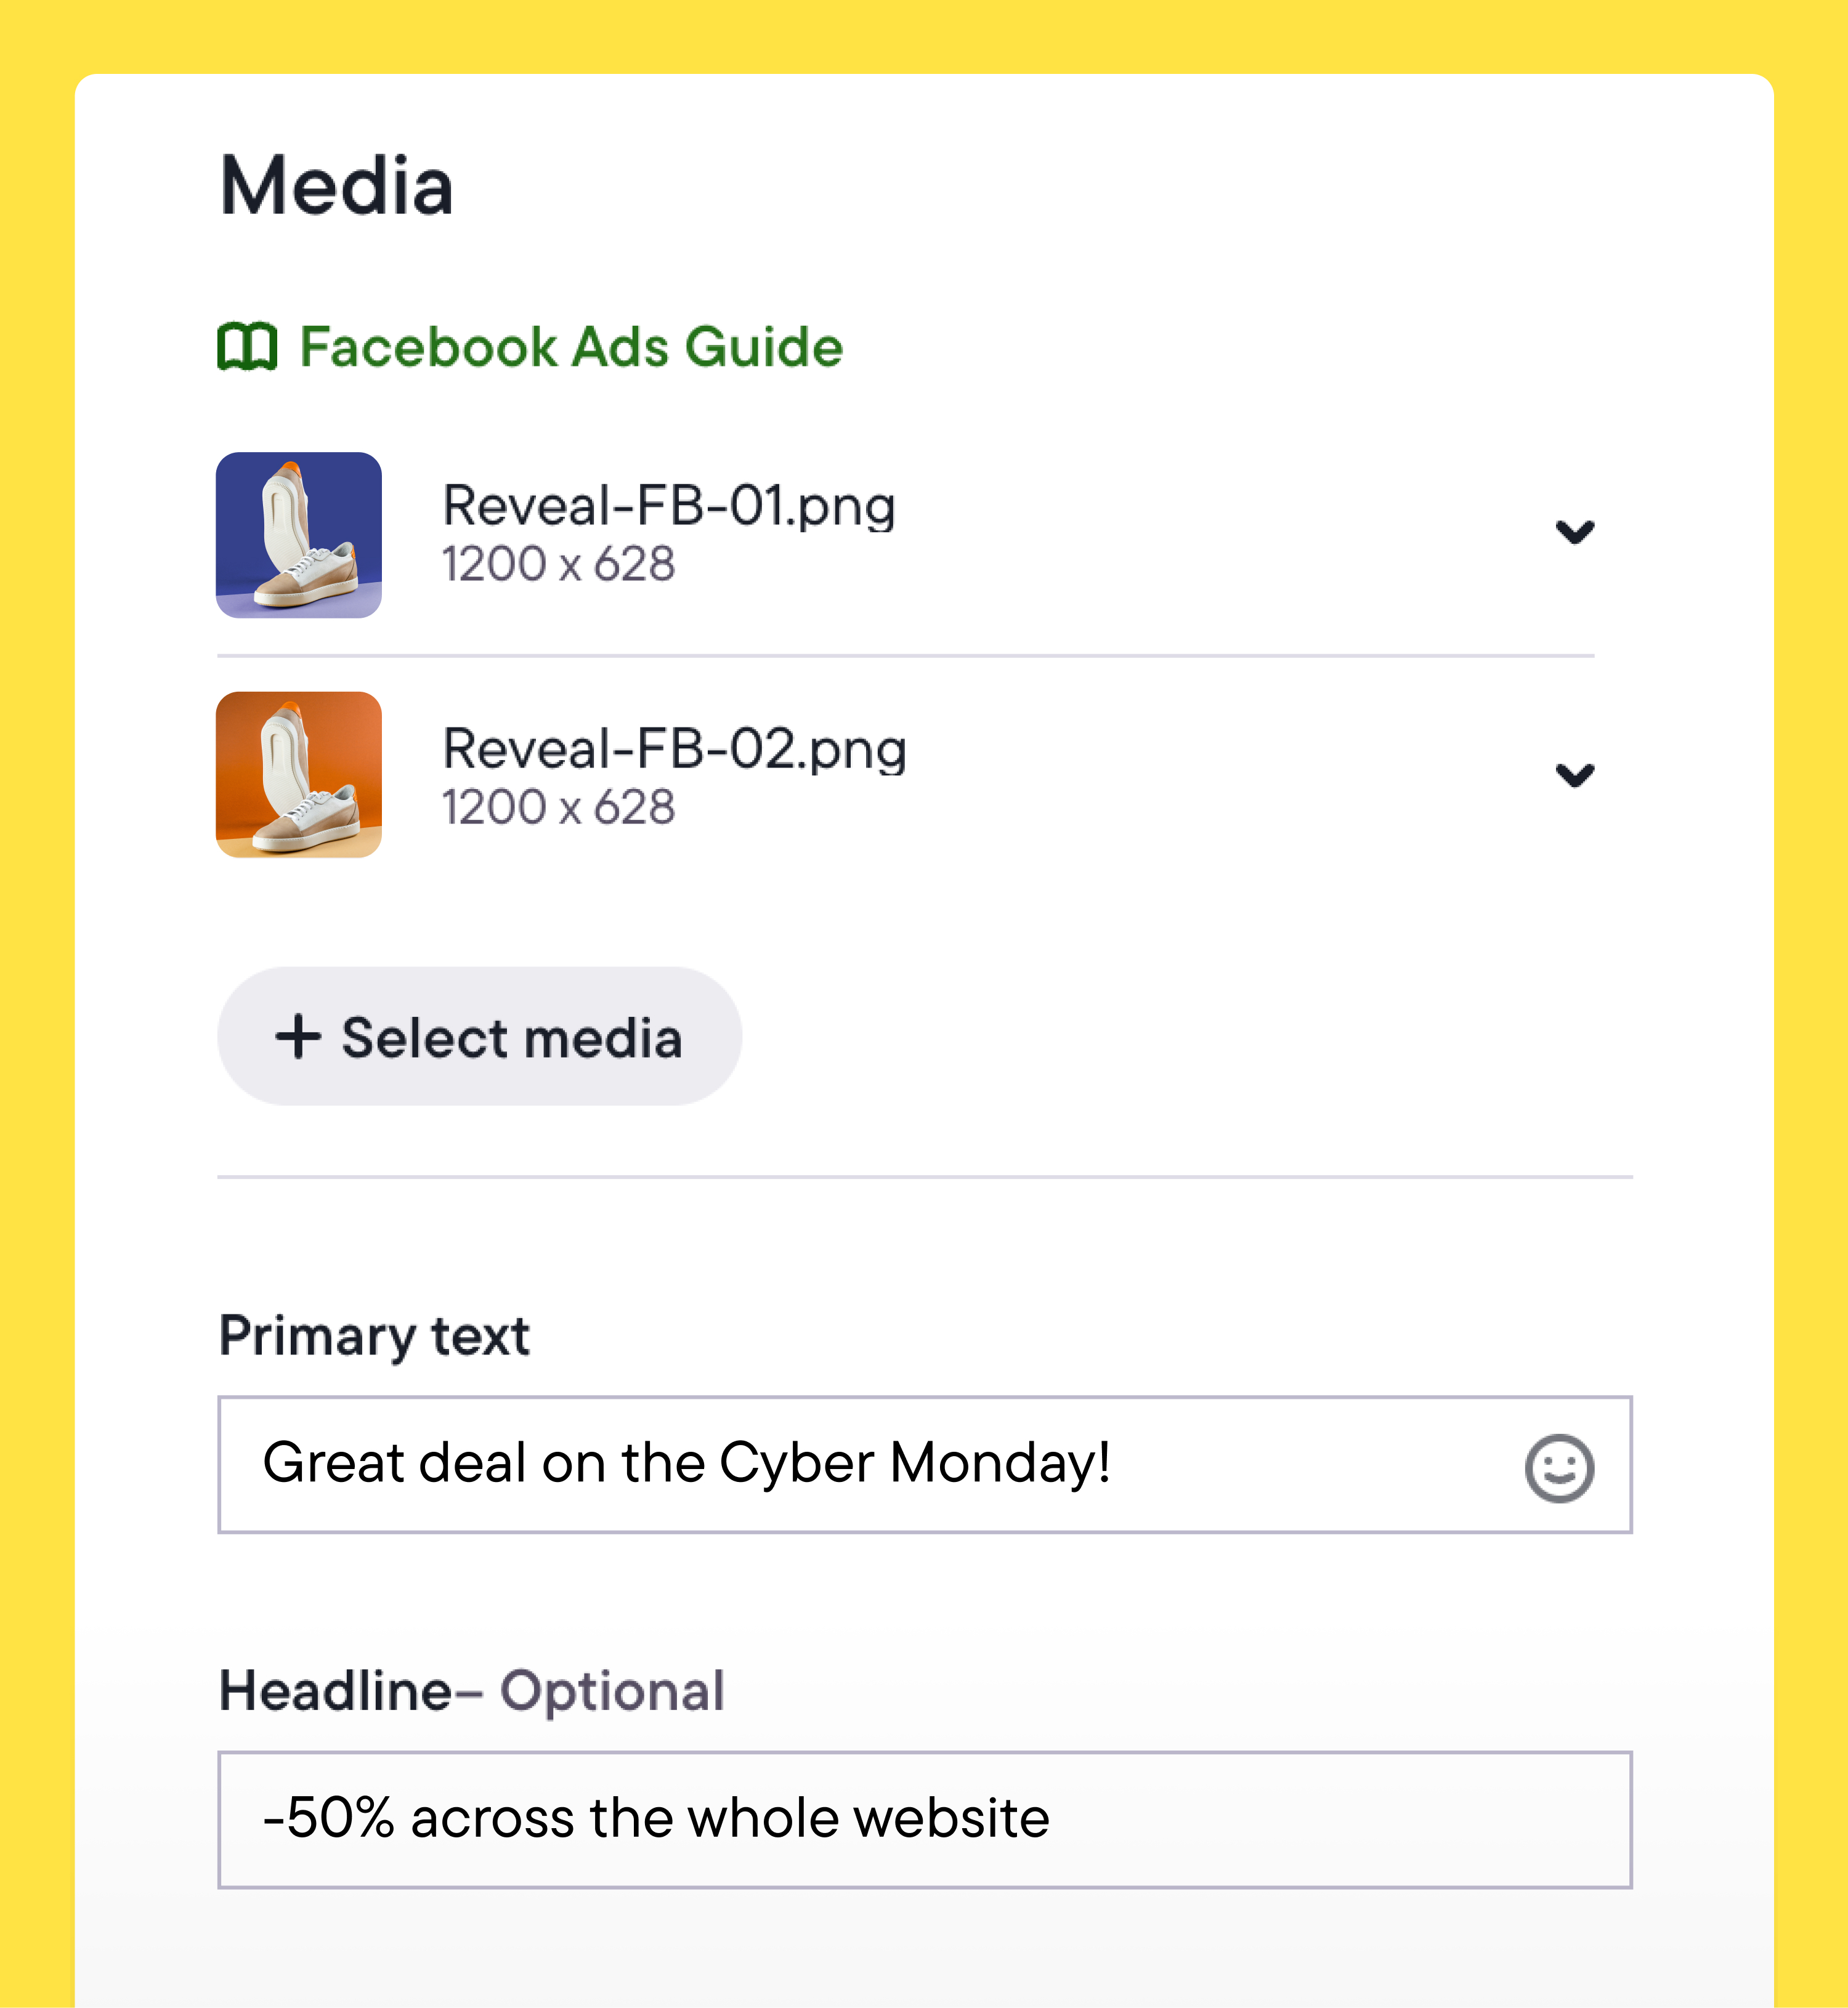
Tests can be structured at launch using Launcher. Instead of manually creating ads one by one, you upload creatives in bulk and generate ad sets from those assets in a few clicks. For example, you can choose to automatically create one ad set per creative, apply the same audience and budget settings across them, and launch the full test from a single workflow.
Because creatives are deployed in a structured way from the start, performance results stay organized across ad sets and campaigns. It’s then much easier to evaluate the launch once data starts coming in.
Scaling a winning creative
In Ads Manager
You identify the top-performing ad and duplicate it into new campaigns or ad sets. Performance is then tracked separately in each location. Manually aggregating the data is the only way you can understand how the creative performs across all the campaigns where it runs.
In Bïrch
Scaling can be automated once a creative reaches a defined performance threshold. For example, a rule might trigger when an ad set reaches ROAS above 2.5 after $1,000 in spend.
In the rule setup, you select the Duplicate action and choose whether the original campaign stays active or pauses. Then, you can decide whether the duplicate should keep the original budget or start with a new one.
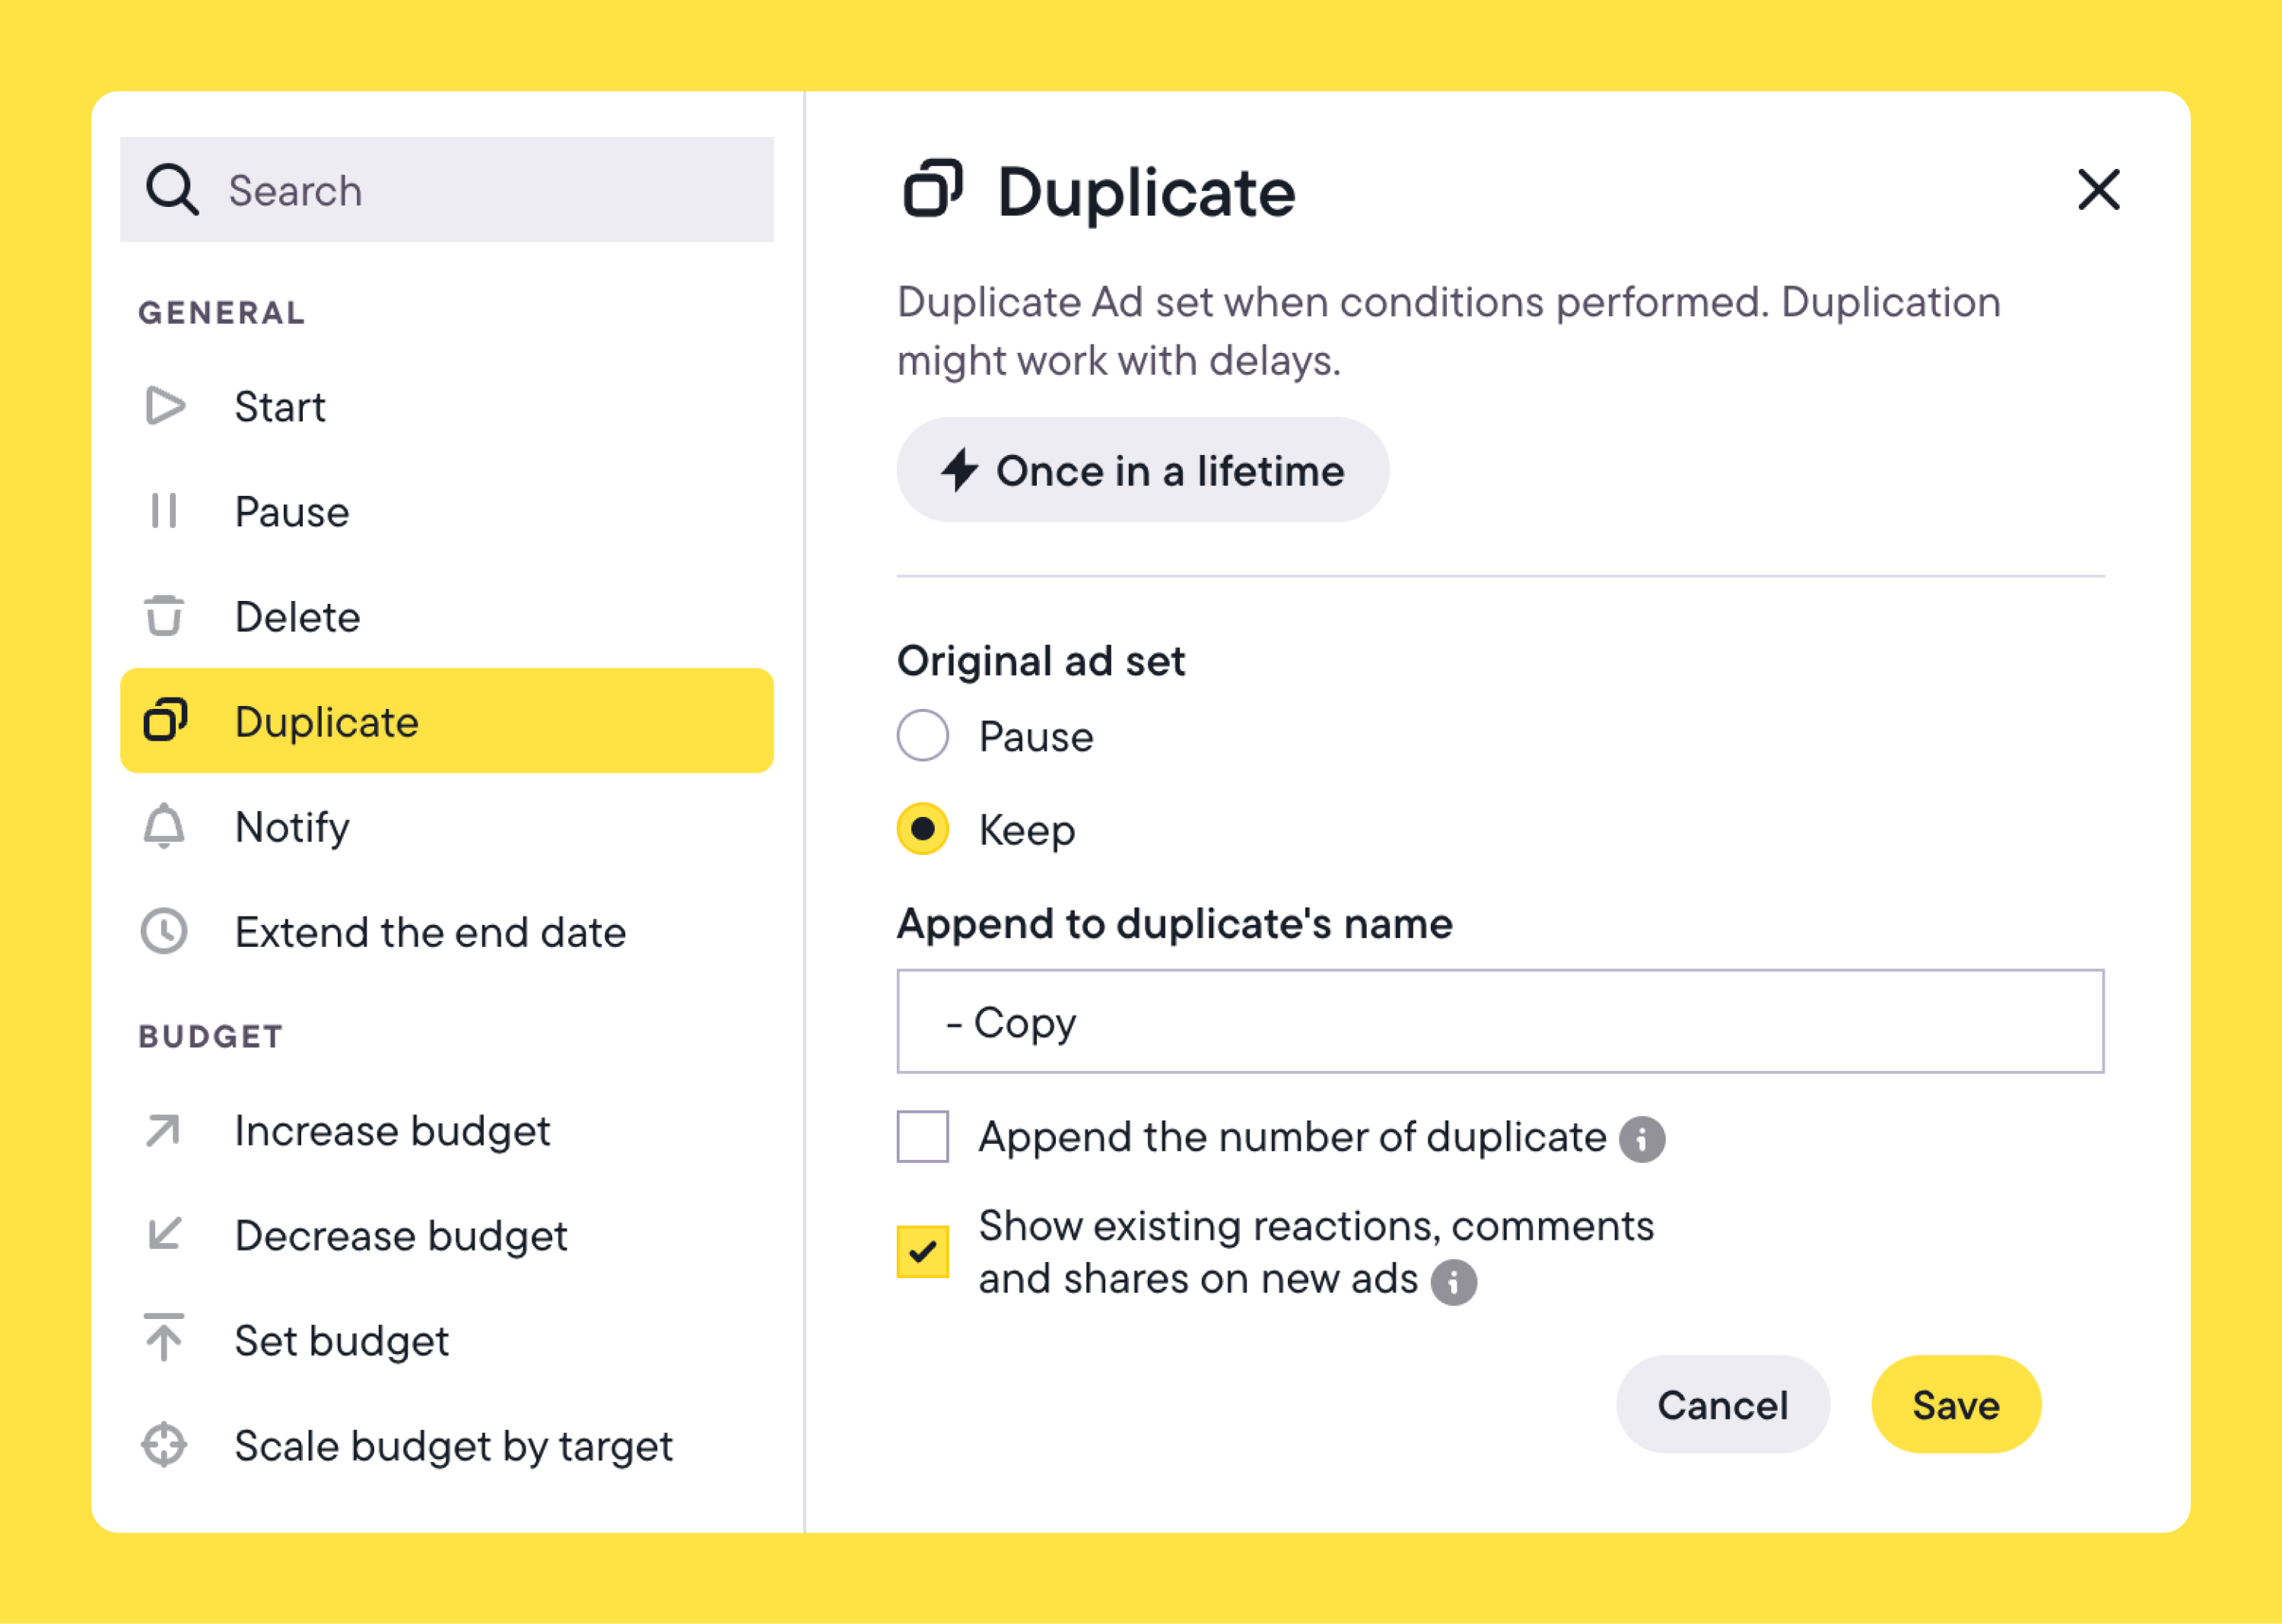
Once the condition is met, Bïrch duplicates the campaign or ad set automatically and applies the new budget settings. Instead of manually duplicating and adjusting budgets each time a creative performs well, scaling happens as soon as the defined performance signal appears.
Spotting creative fatigue
In Ads Manager
You watch for rising CPA, declining CTR, or increasing frequency within each campaign. Fatigue signals are evaluated in context, which means you’re checking performance campaign by campaign.
In Bïrch
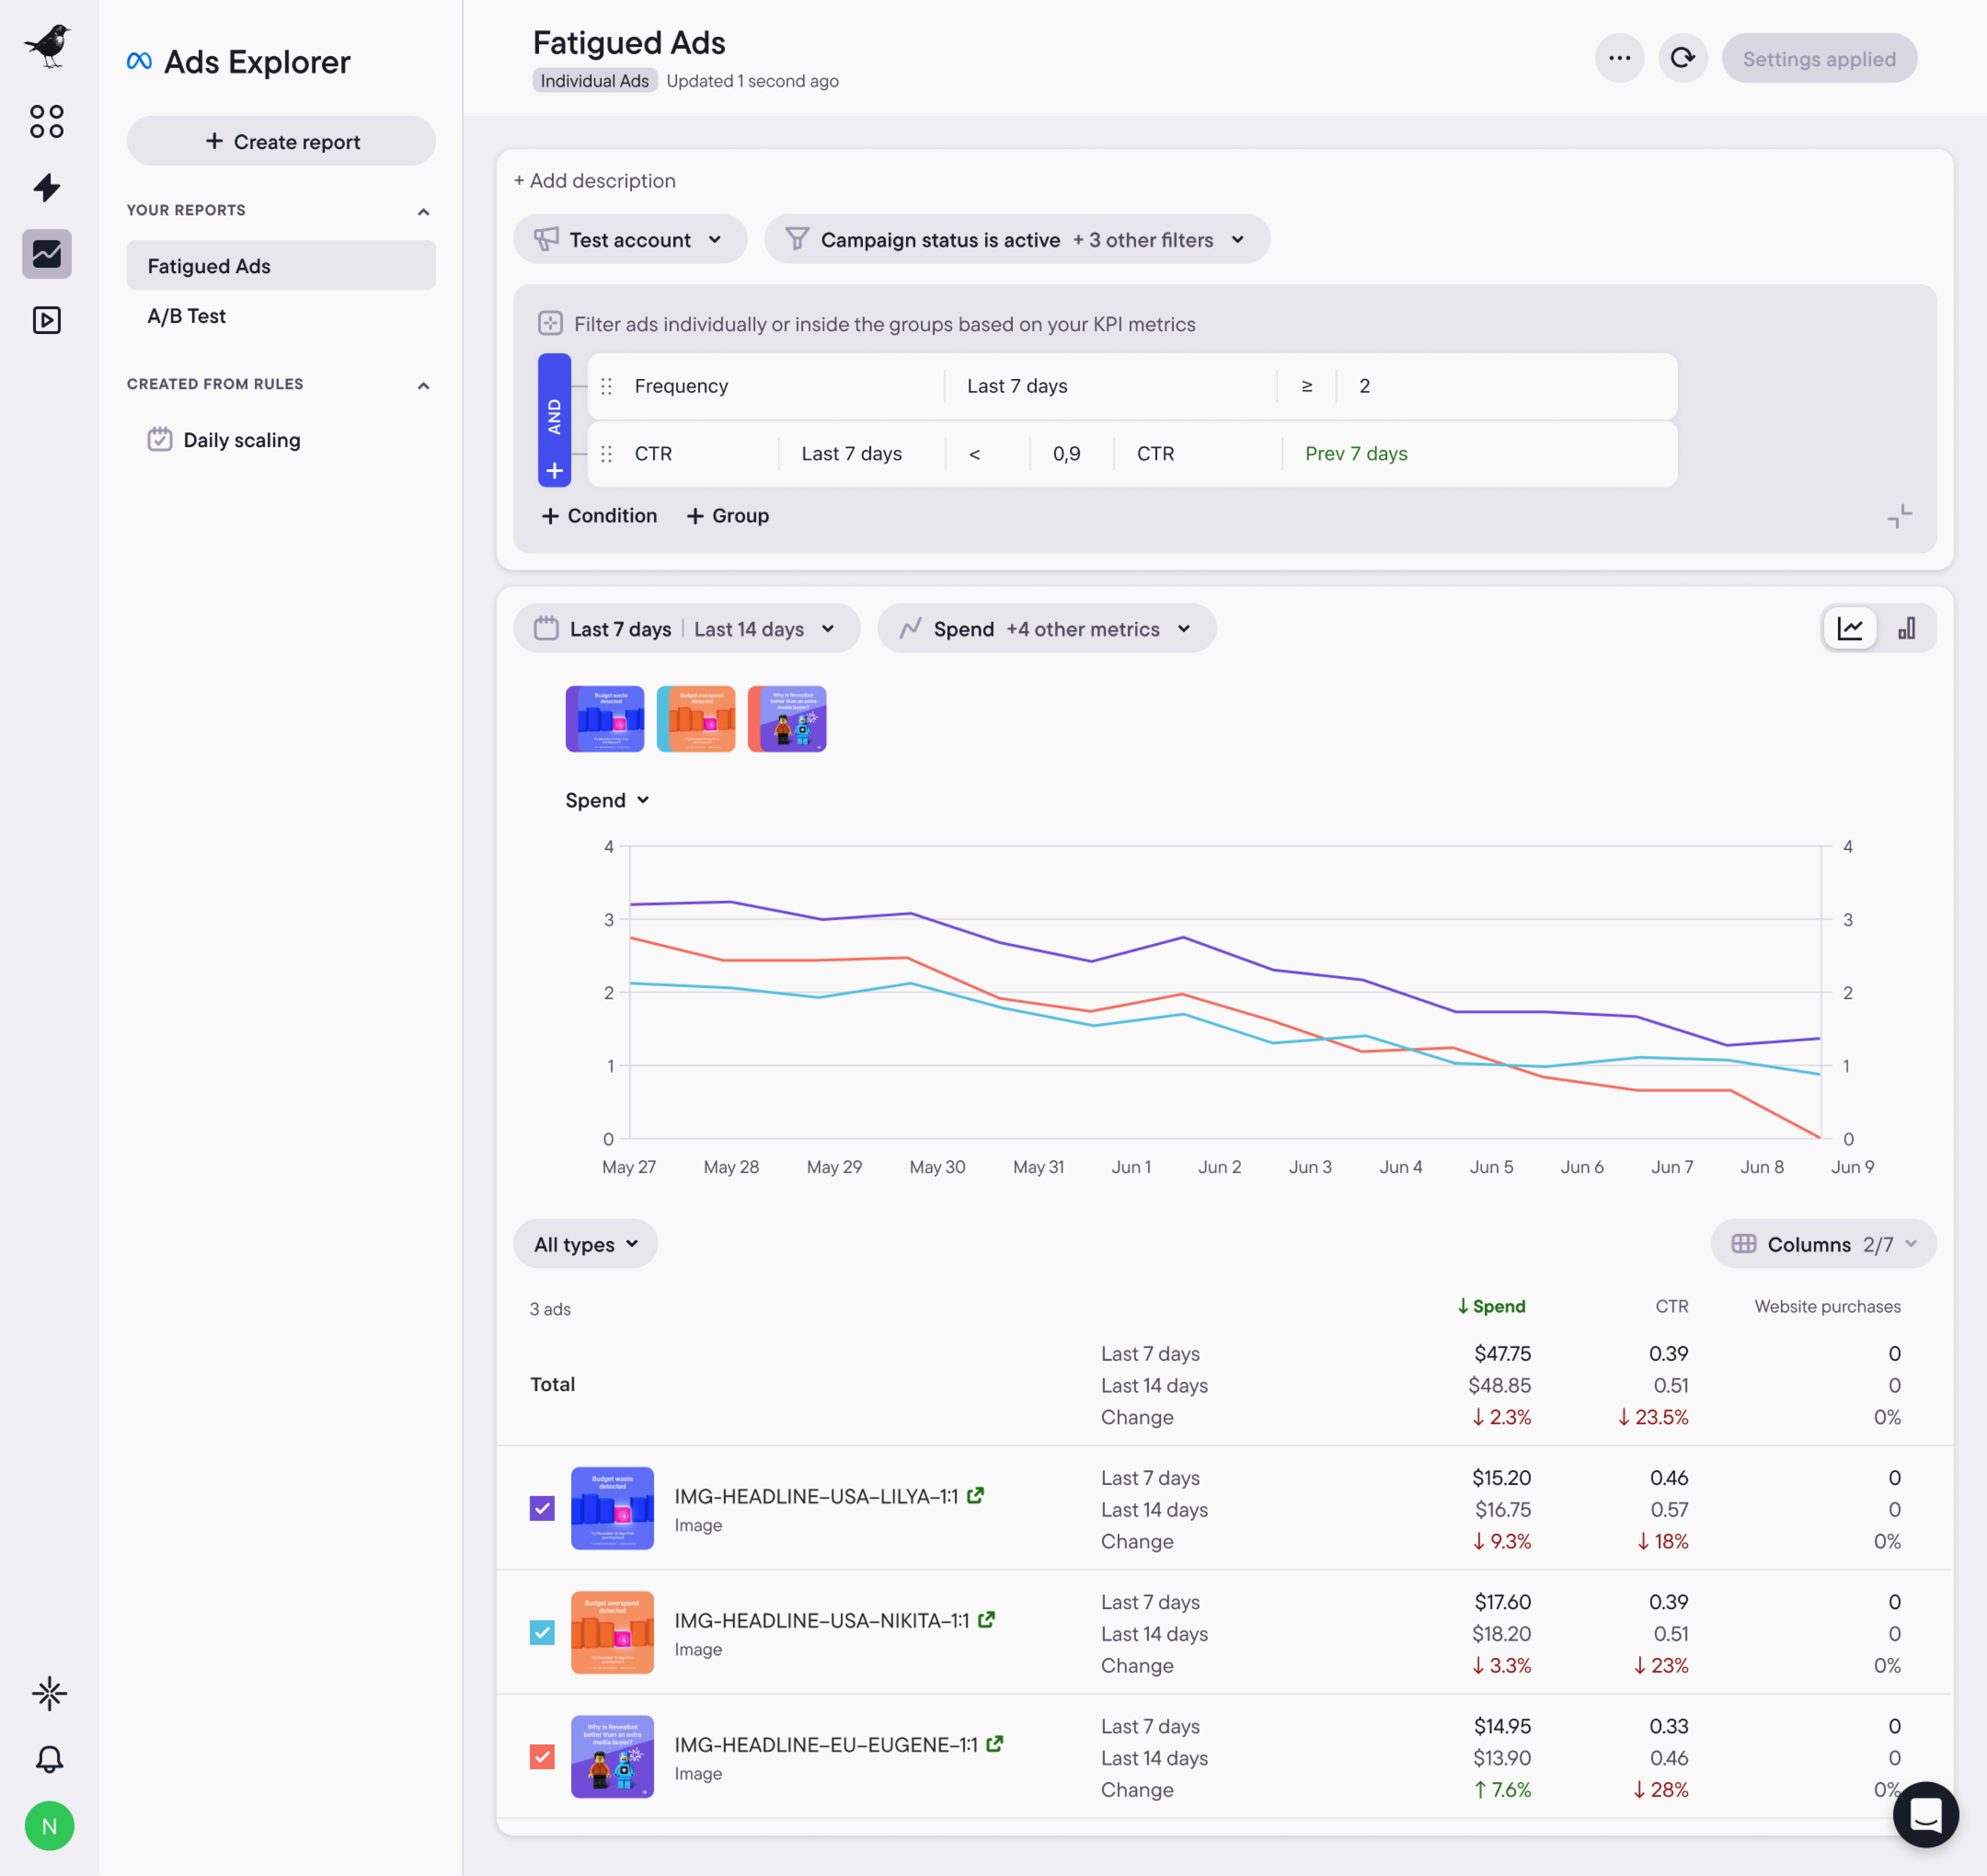
Explorer detects creative fatigue. When creating a report, you can select the Fatigued Ads template, which highlights creatives showing signs of declining performance. Instead of reviewing campaigns individually, Explorer surfaces those creatives across your ads. Teams can quickly identify which assets are starting to become less effective.

When Ads Manager still makes sense
Ads Manager works well when creative analysis stays within a single campaign, as it’s designed primarily for campaign management.
If you’re reviewing a small number of ads and making decisions directly from campaign metrics, the built-in reporting is usually enough.
Who Bïrch works best for
Bïrch is built for performance teams running structured creative testing at scale.
If you’re launching variations across multiple campaigns, reusing assets, and making decisions based on blended or custom metrics, you need advanced reporting that goes beyond the single ad level.
Bïrch works best for teams managing multiple campaigns or accounts where creative testing needs to stay consistent and performance logic needs to be applied the same way each time.
Creative analysis at scale needs structure
With Ads Manager, creative analysis is inefficient when performance data is scattered across campaigns. Instead of seeing what’s working quickly, teams spend time navigating reports and pulling data together to understand which creatives actually deserve more spend.
That lost time becomes more noticeable as creative testing spreads across more campaigns.
Bïrch brings that analysis into one view. Creative performance is aggregated across campaigns and evaluated using consistent performance logic, so teams can quickly identify what to scale and what to retire—without stitching together reports.
See how Bïrch simplifies creative analysis at scale.